


Trends in the U.S. Unemployment rate and the U.S. Yield curve
Interest-Rates / US Interest Rates Dec 15, 2017 - 06:10 AM GMTBy: Donald_W_Dony

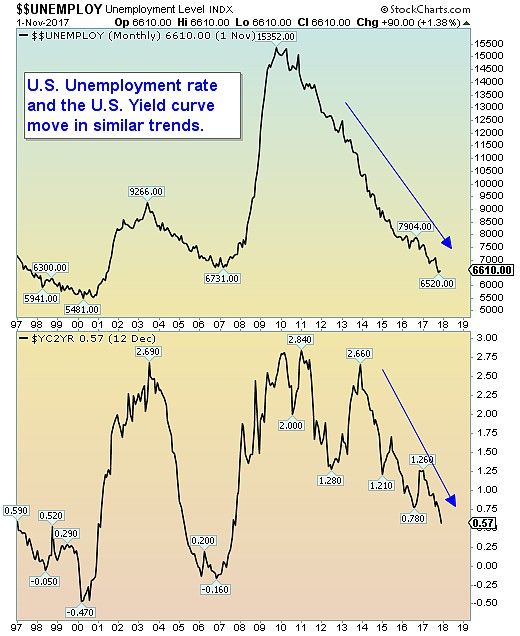
The trends in both the U.S. Unemployment rate and the U.S. Yield curve are linked to similar economic pressures.
The Unemployment rate rises and falls due to a number of key reasons and reflects the changes in the economy.
The U.S. Yield curve acts as a tool for the Fed to conduct its monetary policy in its goal for the long-term health (ie stable prices and sustainable employment) of the economy.
As unemployment starts to increase (as in 2001 and 2008), the Fed lowers the short-term interest rate in an attempt to stimulate the economy. Thus increasing the difference or spread between short-term rates and long-term rates and steepening the curve.
When the unemployment rate continued to climb, the rate spread on the yield curve also widens. 2002-2004 and 2008-2011 are recent examples. As unemployment peaked and begins to recede and the weakness in the economy subsides, the yield spread slowly starts to narrow. 2004-2007 and 2011-2012 are good examples.
The two indicators (the Unemployment rate and Yield curve) act as confirming indicators to each other. They, most importantly, provide a reliable gauge to the U.S. stock market.
For example, when the markets started to rollover, as in 2000 and 2008, this two indicators both began to rise for similar reasons (employers felt less confident about the economy and began reducing overhead costs such as employees and the Fed saw signs of economic weakness and lowered short-term rates and borrowing costs). And as the markets began to recover in 2003 and 2009, these two economic indicators collectively provided confirmation of the return of the bull market.
Bottom line: The U.S. Unemployment rate and the U.S. yield curve are important indicators to the stock market. Though they are a lagging gauge to the S&P 500, they, nevertheless, add a conformational element that standard fundamentals and technicals do not offer.
By Donald W. Dony, FCSI, MFTA
www.technicalspeculator.com
COPYRIGHT © 2017 Donald W. Dony
Donald W. Dony, FCSI, MFTA has been in the investment profession for over 20 years, first as a stock broker in the mid 1980's and then as the principal of D. W. Dony and Associates Inc., a financial consulting firm to present. He is the editor and publisher of the Technical Speculator, a monthly international investment newsletter, which specializes in major world equity markets, currencies, bonds and interest rates as well as the precious metals markets.
Donald is also an instructor for the Canadian Securities Institute (CSI). He is often called upon to design technical analysis training programs and to provide teaching to industry professionals on technical analysis at many of Canada's leading brokerage firms. He is a respected specialist in the area of intermarket and cycle analysis and a frequent speaker at investment conferences.
Mr. Dony is a member of the Canadian Society of Technical Analysts (CSTA) and the International Federation of Technical Analysts (IFTA).
Donald W. Dony Archive |
© 2005-2022 http://www.MarketOracle.co.uk - The Market Oracle is a FREE Daily Financial Markets Analysis & Forecasting online publication.