


How to Know When a Stocks Bull Market Is About to End – Part I
Stock-Markets / Stock Market 2017 Nov 27, 2017 - 04:05 PM GMTBy: Chris_Vermeulen

 Knowing when a bull market is about to end is critical for both traders and investors. Why? Because once a bull market ends the price movement characteristics of stocks and indexes change dramatically and require different strategies to be used in order to profit from falling prices and increased volatility.
Over the next couple of weeks, we will be expanding on this topic to add several more parts because there are some really exciting things you should know as we move towards 2018.
So, let’s kick things off with the first few data points that tell us that the bull market is about to end.
We have been in the process of writing about the technical pattern in the VIX when we came across some research by Gordon Long, and Peter Schiff of Euro Pacific Capital illustrating the correlation of the CAPE/VIX Ratio to stock market Recessions go back to 1990.
We have been warning about a US Recession coming sometime in 2018 and each month more signs that the bull market end is near present themselves.
Gordon Long put things into perspective stating:
– The long-term CAPE/VIX ratio suggests a strong possibility of a US Recession in 2018.
– The VIX is in a clear falling wedge suggesting historic lows will soon end.
– The Shiller CAPE at ~30 is currently at the third highest level in recorded US Market history. Chances of it falling in 2018 are extremely high.
– Historical CAPE/VIX ratio is signaling an extreme reading and points to weakness.
This, the CAPE/VIX Ratio chart, clearly shows the extended levels of asset valuations in relation to previous bubble economies. The expansion of this ratio from the 2009 lows is massive.
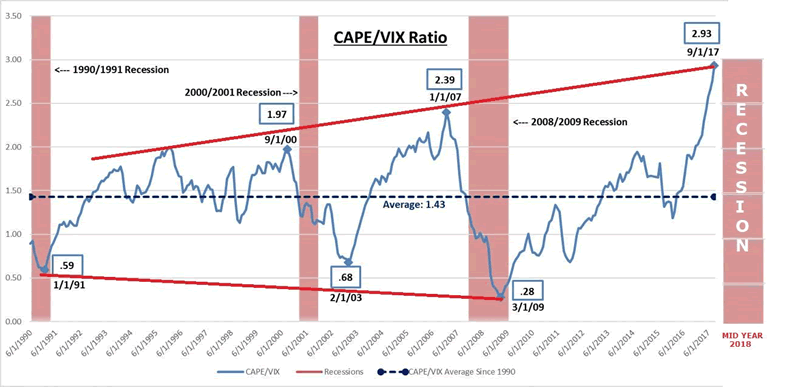
Additionally, this expansion correlates directly with the Fed’s Quantitative easing programs. We can see that Fed policies have backed a majority of this move to drive economic and asset valuation levels higher resulting in what could possibly be one of the biggest bubble economies ever created.
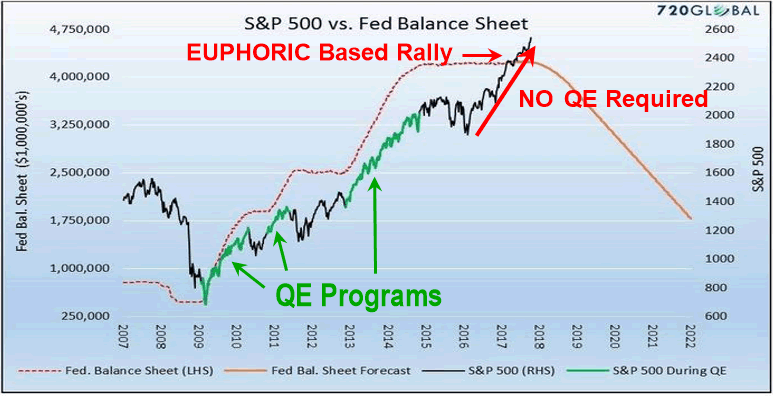
Just look at the chart below of the SP500 index price and
the Feds quantitative easing programs…
The most interesting component of the chart above is the move higher after the US Elections. This move was made without a Fed based QE effort. We believe it is the final Euphoria move of the bull market. Typically, the first year of a new president is also a very strong year for stocks, so the move is likely a blend of a presidential rally, and investor psychology pushing stock evaluations and prices sky high.
Investor Sentiment Cycle
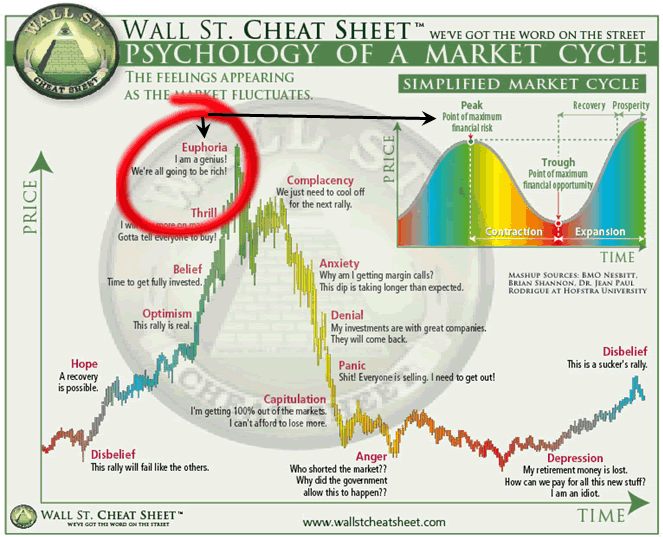
We don’t expect anything massive to disrupt this rally currently, but we are cautious and urge all investors to be cautious as well. Investing long-term capital into the stock market at this level knowing the end is near, carries the maximum financial risk for investors.
As capital is continually searching for the best environment for ROI, it is consolidating into the best areas of the global economy for survival purposes. Currently, money is flowing into stocks as investors chase higher prices expecting to make more money.
Conclusion:
What does this mean for investors and global markets?
In our opinion, it means that optimism is outpacing actual production on a global basis and when reality hits, we may be in for a bumpy ride. Until then, we should continue to be very cautiously bullish and try to ride this out as long as it continues. We can’t stand in front of a freight train and expect to stop it. This move may continue for another few weeks or months, but at some point, it will collapse.
When a couple large institutions decide to start distributing shares in fear of a market top their combined actions will eventually trigger panic with other large firms who will then also want to unload their shares before it’s too late. This is what triggers the first massive move down in price right after the Euphoria stage, thus neutralizing the upward bias in stocks. This help us know when we should change our investment positions and strategies going forward.
This is only Part I of this series, stay tuned as we have some exciting information, charts, strategies to show you as we head into 2018 so you can potentially make some life-changing profits from stocks and commodities.
If you want accurate and timely market forecasts, Daily Video Forecasts, ETF trades, explosive stock trades, or all of the above Visit us at www.TheTechnicalTraders.com
These moves could be explosive and we want to assist you in profiting from them with our advanced research and technology. Check out www.ActiveTradingPartners.com today to learn more.
Chris Vermeulen
www.TheGoldAndOilGuy.com – Daily Market Forecast Video & ETFs
www.ActiveTradingPartners.com – Stock & 3x ETFs
Chris Vermeulen is Founder of the popular trading site TheGoldAndOilGuy.com. There he shares his highly successful, low-risk trading method. For 7 years Chris has been a leader in teaching others to skillfully trade in gold, oil, and silver in both bull and bear markets. Subscribers to his service depend on Chris' uniquely consistent investment opportunities that carry exceptionally low risk and high return.
Disclaimer: Nothing in this report should be construed as a solicitation to buy or sell any securities mentioned. Technical Traders Ltd., its owners and the author of this report are not registered broker-dealers or financial advisors. Before investing in any securities, you should consult with your financial advisor and a registered broker-dealer. Never make an investment based solely on what you read in an online or printed report, including this report, especially if the investment involves a small, thinly-traded company that isn’t well known. Technical Traders Ltd. and the author of this report has been paid by Cardiff Energy Corp. In addition, the author owns shares of Cardiff Energy Corp. and would also benefit from volume and price appreciation of its stock. The information provided here within should not be construed as a financial analysis but rather as an advertisement. The author’s views and opinions regarding the companies featured in reports are his own views and are based on information that he has researched independently and has received, which the author assumes to be reliable. Technical Traders Ltd. and the author of this report do not guarantee the accuracy, completeness, or usefulness of any content of this report, nor its fitness for any particular purpose. Lastly, the author does not guarantee that any of the companies mentioned in the reports will perform as expected, and any comparisons made to other companies may not be valid or come into effect.
Chris Vermeulen Archive |
© 2005-2022 http://www.MarketOracle.co.uk - The Market Oracle is a FREE Daily Financial Markets Analysis & Forecasting online publication.