


Facebook Traders: Tech Giant + Technical Analysis = Thumbs Up
Companies / Company Chart Analysis Nov 18, 2017 - 03:45 PM GMTBy: EWI

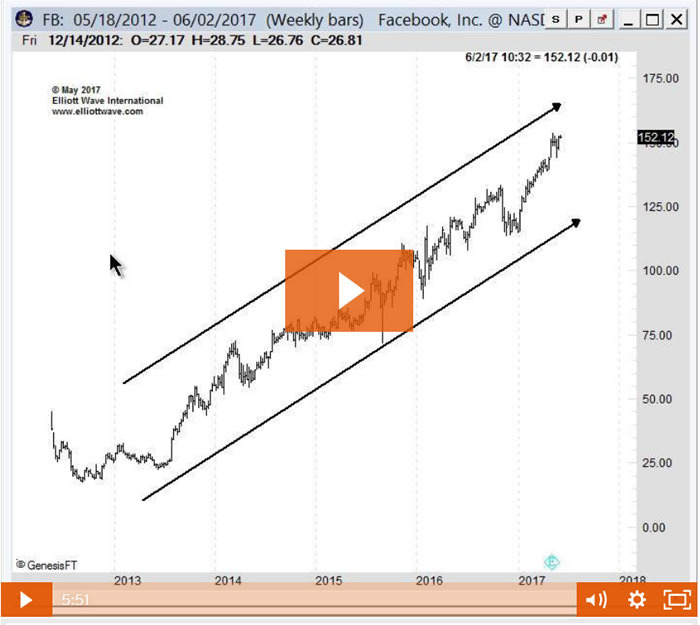
 See how two technical indicators, RSI and ZLR, helped anticipate the resumption of FB's uptrend -- back in May
Some days, the fundamental backdrop of the markets you follow is as peaceful and quiet as a Zen garden. The news cycle is calm and the mainstream predictions about price are clear.
Other days, though, that backdrop is as chaotic as the Jersey turnpike during rush hour; jackhammers of breaking news pound in your ears while the "horns" of prognostication honk in opposite directions.
Wednesday, November 1 was a turnpike kind of day for the likes of Facebook, as market followers braved a media maelstrom over the tech giant's testimony on Capitol Hill, one of three social networks accused of providing a broad, public forum for Russia to influence the 2016 U.S. presidential election via strategically divisive Facebook ads and posts.
In the wake of the House & Senate Intelligence Committee hearing, Facebook analysts were all over the map on how the investigation and criticism will affect the tech giant's stock moving forward. Here, these news items from November 1 and 2 capture the conflicting outlooks:
Facebook is invincible: "Facebook Shatters Earnings... show[ing] just how insulated its business remains from political risks." (Fortune)
Facebook is vulnerable: "Facebook shares fell as much as 2% after it said on a conference call that 2018 expenses would rise 45% to 60%... for more security." (CNBC)
Facebook is invincible: "If you haven't bought Facebook Inc, What are you Waiting for?" (Investorplace.com)
Facebook is vulnerable: "Facebook Inc (FB) Warns Drop in Profits As it Ramps Up Security" (Value Walk)
Not to get too meta here, but if Facebook traders had their own Facebook page, this news-driven uncertainty would illicit a big, fat Facebook thumbs down.
So, what's the alternative? When you have a company as hugely popular as Facebook, stopping the news cycle from churning out gossip, hearsay, rumbles and rumors is impossible.
That's true. You can't stop the news. But you can stop yourself from being distracted by it.
See, for our Trader's Classroom instructor Jeffrey Kennedy, the one way to objectively gauge price trends is with technical analysis. It's an airtight, noise-controlled assessment of market action that shuts out fundamentals and focuses strictly on the "mathematics" of price patterns.
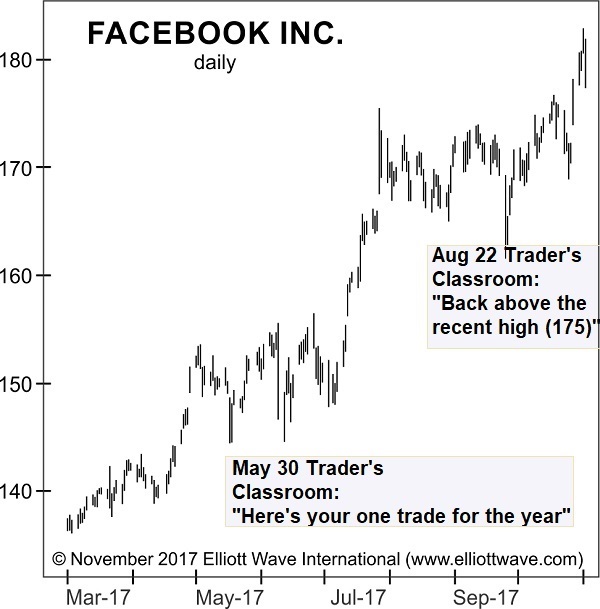
Take Facebook. Six months ago, in his May 30 Trader's Classroom, Jeffrey praised the "versatility" of technical analysis; namely, how it works on every liquid market, virtually every timeframe, and for every type of trader from day scalper to long-term campaigner. In his video lesson, Jeffrey tracked the progress of three main indicators -- the Relative Strength Index (RSI) "phase change," Elliott wave analysis, and the MACD Zero Line Reversal (ZLR) -- all of which pointed to the resumption of Facebook's uptrend.
From there, Facebook shares broke out of their months-long sideways trend and took to the upside. Then, in his August 22 Trader's Classroom, Jeffrey returned to the ZLR on Facebook's price chart and showed how this simple indicator confirmed the tech stock's rally was well on its way to setting new highs above 175.
The following chart of Facebook shows exactly when and where Jeffrey's Trader's Classroom episodes aired within the market's powerful rally.
We eagerly invite you to listen to an exclusive compilation of the May 30 and August 22 Trader's Classroom webisodes to hear Jeffrey walk traders through his "buy-side oriented" analysis of Facebook in real-time:
Free Trader's Workshop: "Battle-Tested Tools to Boost Your Trading Confidence"Get 7 free lessons that will give you the tools you need to confidently identify trading opportunities in the charts you follow every day. Register now and get your first 6 lessons instantly. Then, on Monday, Nov. 20, join Jeffrey Kennedy for a live webinar where he will show you how to apply these techniques to live charts of some of today's most popular stocks, like Facebook, Amazon and Netflix. |
This article was syndicated by Elliott Wave International and was originally published under the headline Facebook Traders: Tech Giant + Technical Analysis = Thumbs Up. EWI is the world's largest market forecasting firm. Its staff of full-time analysts led by Chartered Market Technician Robert Prechter provides 24-hour-a-day market analysis to institutional and private investors around the world.
© 2005-2022 http://www.MarketOracle.co.uk - The Market Oracle is a FREE Daily Financial Markets Analysis & Forecasting online publication.