STOCKS HIT AN AIR POCKET……AGAIN!
Stock-Markets / Stock Market 2017 Nov 10, 2017 - 04:46 PM GMTBy: Enda_Glynn
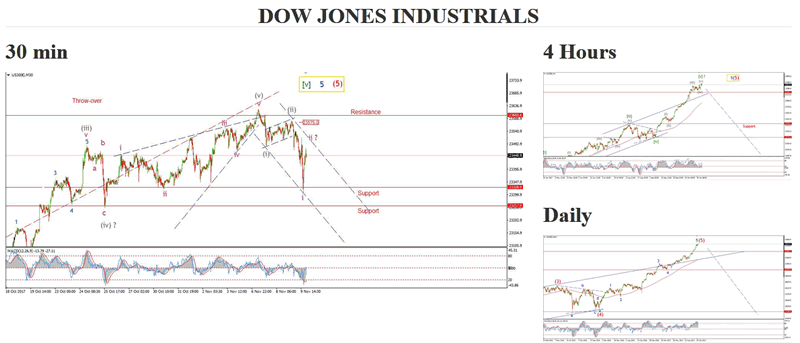
 Stocks got their fist little taste of pain yesterday as we close out this half cycle.
Full cycle losses in the coming bearmarket will extend to at least 60% in my estimation.
But it remains to be seen if this new decline is the beginning of something greater.
The DOW was down more than 250 points today in a possible series of 1,2 waves.
It is too early to say just yet,
But If I were a bull,
I might ask this question:
why do stocks nose dive, when everything is supposedly so great?
It has got to be a head sctratcher!
In general,
there are now warning signs flashing red in both current market internals,
and investors risk appetite,
as evidenced by the spike in yields in high yield credit.
couple this with the extremes sentiment,
and the advanced state of the elliott wave pattern in the DOW,
And you get a big picture of a market that is turning at down at a large degree of trend.
I have maintained over the last month,
that now is the time for caution and not speculation.
When the crowd has all run to one side of the boat,
There is only one outcome,
the boat is going to tip over!

My Bias: market topping process ongoing
Wave Structure: Impulsive 5 wave structure, possibly topping in an all time high.
Long term wave count: Possibly topping in wave (5)
Last night I spoke of a possible bearish Elliott wave signal in place off the high.
Todays market hit an air pocket right at the open!
The price was down 263 points at the low of the session.
The price has rebounded again this evening,
So it is unclear yet if the structure will develop into a larger five wave pattern to the downside.
I have labelled the chart with the bearish interpretation,
Which views the declien as a series of 1,2 waves to the downside.
For tomorrow;
wave (ii) grey sits at 23574.73,
This level must hold for the bearish interpretation to hold.

My Bias: topping in a large correction wave [4].
Wave Structure: Double combination higher in wave [4] red.
Long term wave count: wave [4] target $70
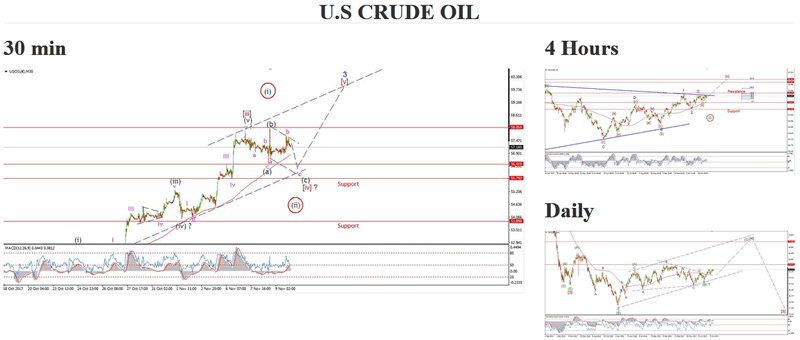
The correction in wave [iv] is not yet complete after todays session.
The price rose today in a possible three wave pattern in a 'b' pink.
This should be followed by a further decline in wave 'c'.
The overall structure in wave [iv] is taking the form of a double combination.
This explains the very erratic price action over the last few days.
Wave [iv] should complete once the price reaches the lower trendline of the minor trend channel.
55.79, the previous fourth wave, remains the likely target from here.
For tomorrow;
the minimum target for wave (c) grey lies just below wave (a) at 56.41.
WANT TO KNOW the next big move in the Dollar, GOLD and the DOW???
Check out our membership plan over at Bullwaves.org,
You can see into the Elliott wave future every night!
Enda Glynn
http://bullwaves.org
I am an Elliott wave trader,
I have studied and traded using Elliott wave analysis as the backbone of my approach to markets for the last 10 years.
I take a top down approach to market analysis
starting at the daily time frame all the way down to the 30 minute time frame.
© 2017 Copyright Enda Glynn - All Rights Reserved
Disclaimer: The above is a matter of opinion provided for general information purposes only and is not intended as investment advice. Information and analysis above are derived from sources and utilising methods believed to be reliable, but we cannot accept responsibility for any losses you may incur as a result of this analysis. Individuals should consult with their personal financial advisors.
© 2005-2022 http://www.MarketOracle.co.uk - The Market Oracle is a FREE Daily Financial Markets Analysis & Forecasting online publication.


