The Strange Behavior of Gold Investors from Monday to Thursday
Commodities / Gold & Silver Stocks 2017 Nov 10, 2017 - 04:38 PM GMTBy: Dimitri_Speck
 Dear Investor,
You are undoubtedly aware of one or another stock market anomaly, such as e.g. the frequent weakness in stock markets in the summer months, which the well-known saying “sell in May and go away” refers to. Apart from such widely known anomalies, there are many others though, which most investors have never heard of. These anomalies can be particularly interesting and profitable for investors – and there are several in the precious metals sector as well. Today I am going to introduce one of those to you.
Gold investors dead asleep for days?
To this end I am going to examine the performance of gold and gold stocks broken down by days of the week.
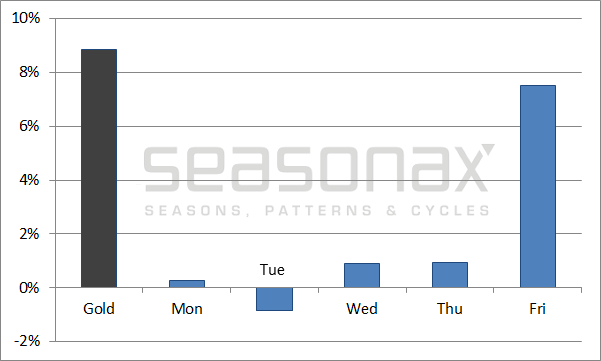
The first chart shows the annualized performance of the gold price in USD terms since 2000 (black bar), as well as the annualized gain generated on individual days of the week (blue bars).
I have measured the returns based on closing prices, thus the performance achieved on Tuesday equals the average percentage change between the close of trading on Monday and the close on Tuesday.
Gold, performance by days of the week, 2000 to 2017

Friday stands out markedly
Source: Seasonax
As the chart illustrates, one day really stands out: Friday. With an annualized return of 7.50 percent it reflects almost the entire annualized gain of 8.84 percent generated by the gold price over the time period under review.
By contrast, almost nothing noteworthy happened in the gold market from Monday to Tuesday. On Tuesday prices even declined slightly on average.
The difference – which has been measured over a period of no less than 4,585 trading days – is obviously quite significant. This suggests that these patterns are not a coincidence.
Gold investors indeed appear to be mired in deep sleep from Monday to Tuesday, or at the very least they are showing very little enthusiasm on these days.
The days of the week under the magnifying glass
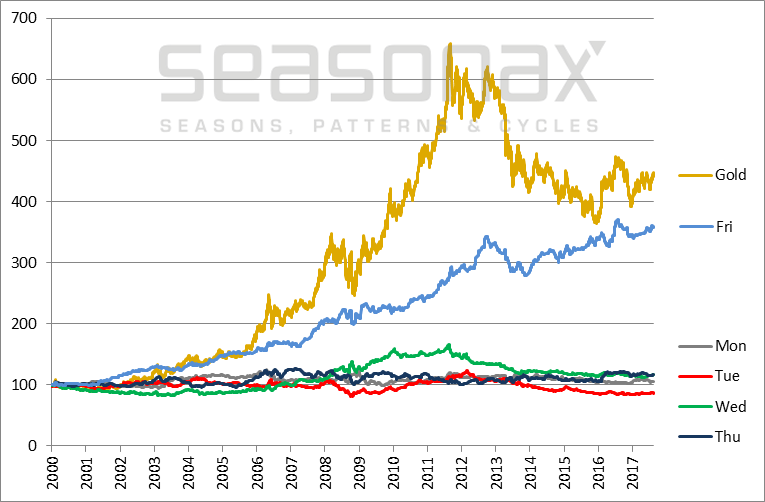
What exactly was the trend in this pattern over time? The next illustration shows the indexed performance of gold since the turn of the millennium in gold color, as well as that of individual days of the week in other colors.
Gold, cumulative performance by days of the week, 2000 to 2017, indexed

A steady uptrend was in evidence on Fridays
Source: Seasonax
As the chart shows, prices essentially tended to move sideways over the first four days of the week. Only in 2009 did Wednesday (green line) manage to generate a somewhat stronger average return as well.
The gains in the gold price over the entire period of almost 17 years were primarily achieved on Fridays. The blue line depicting the cumulative returns achieved on Friday is in a very steady uptrend. On Friday prices frequently even managed to rise even when the gold price declined overall in the course of the year, such as e.g. in 2014.
In short, Friday is indeed quite an unusual day.
The action in gold stocks is even more extreme!
Given that Friday appears to hold a special position in the gold market, the question arises whether and to what extent gold stocks are affected by it. After all, the trend in gold stock prices depends on the trend in the gold price.
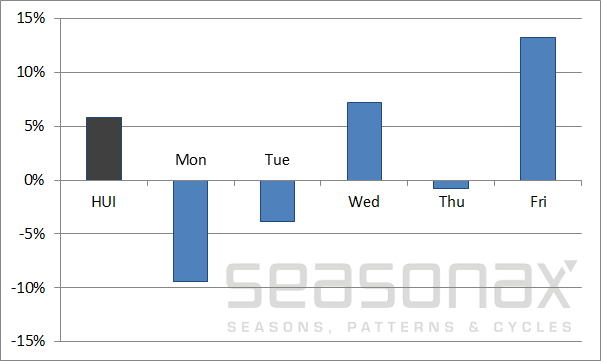
The next chart therefore shows the annualized performance of the HUI Index of unhedged gold mining stocks since the turn of the millennium (black bar) vs. the annualized performance achieved on individual days of the week (blue bars) since the turn of the millennium.
HUI, performance by days of the week, 2000 to 2017

Friday shines brightly, Monday is weak
Source: Seasonax
Once again Friday is the by far strongest day. Its special status is even more pronounced than in gold itself: gold stocks on average rose by 13.28 percent annualized on Fridays, while the HUI on average gained only 5.76 percent over the week as a whole. Or putting it differently: Investors who were exclusively invested on this single day every week, were able to achieve more than twice the return delivered by a buy and hold investment!
Moreover, in gold stocks the patterns from Monday to Thursday show a lot more differentiation than those in gold itself. For instance, the average gain recorded on Wednesdays actually exceeded the cumulative gain in the HUI over the week as a whole as well. By contrast, the average performance on Mondays was truly abysmal. Someone who invested in the HUI exclusively on Mondays would have suffered an annualized loss of 9.40 percent!
The weekly performance of gold stocks under the magnifying glass
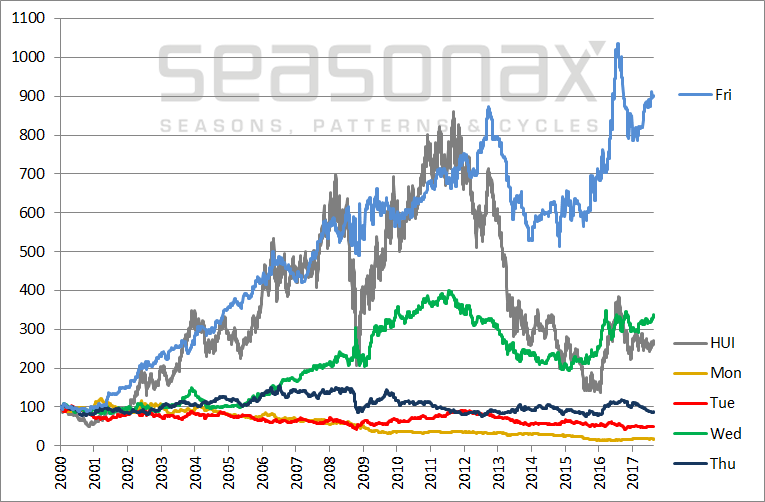
The question of the cumulative performance broken down by days of the week arises in connection with gold stocks as well of course. The next illustration therefore shows the indexed returns of the HUI Index in gray, and those of individual days of the week in other colors.
HUI, cumulative performance by days of the week, 2000 to 2017, indexed

Knocking it out of the park: Friday beats them all!
Source: Seasonax
As the chart shows, the blue line depicting the performance of the HUI on Fridays faithfully tracked the rally in gold prices in the first several years after the turn of the millennium. However, a welcome divergence emerged during the financial crisis of 2008, which had almost no discernible effect on the performance achieved on Fridays. Thereafter, the blue line by and large continued its ascent, even though the trend in the HUI as such was quite dismal in recent years. Currently the cumulative return achieved on Fridays stands far above that generated by the HUI.
This once again underscores how extraordinary the performance of gold mining stocks on Fridays actually was.
Compare this to the terrible downtrend in gold mining shares on Mondays, which is found at the very bottom of the chart. The yellow line declines steadily. On Monday, prices even tended to decline in years that were otherwise strongly bullish for gold mining stocks.
Take advantage of anomalies in gold and mining stocks!
The study shows clearly that anomalies in the performance on individual days of the week are extremely pronounced in the gold sector. Traders and investors can take advantage of them and quickly find a plethora of other exploitable market anomalies with the help of the Seasonax app available on Bloomberg and Thomson-Reuters. While nothing is ever guaranteed in the markets, one should certainly let the probabilities work in one's favor!
Yours sincerely,
Dimitri Speck,
Founder of Seasonax and Head Analyst of 90 Tage Trader
PS: individual days of the week are an underestimated source of unusual performance potential!
Dimitri Speck,
Dimitri Speck is the founder of Seasonax and author of The Gold Cartel, published by Palgrave Macmillan.
© 2017 Copyright Dimitri Speck - All Rights Reserved - Disclaimer: The above is a matter of opinion provided for general information purposes only and is not intended as investment advice. Information and analysis above are derived from sources and utilising methods believed to be reliable, but we cannot accept responsibility for any losses you may incur as a result of this analysis. Individuals should consult with their personal financial advisors.
© 2005-2022 http://www.MarketOracle.co.uk - The Market Oracle is a FREE Daily Financial Markets Analysis & Forecasting online publication.


