Silver Is Underperforming Gold
Commodities / Gold and Silver 2017 Oct 25, 2017 - 12:23 PM GMTBy: The_Gold_Report
 Technical analyst Clive Maund charts silver and discusses its relationship with gold. Like gold, silver now appears to be completing an intermediate Head-and-Shoulders top within a much larger and very bullish Head-and-Shoulders bottom pattern. Both these Head-and-Shoulders tops are related to the Head-and-Shoulders bottom completing in the dollar index, that we look at in the parallel Gold Market update.
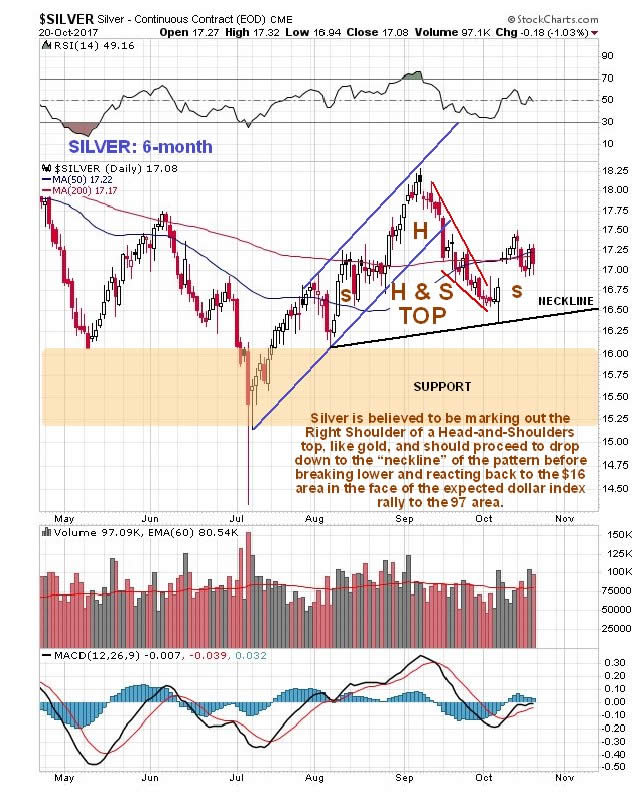
On silver's latest 6-month chart we can see how the gap breakout out of the small Falling Wedge downtrend over a week ago did not lead to follow through, and instead the price has moved to complete the Right Shoulder of the now clearly discernable Head-and-Shoulders top that has been forming since the beginning of August. It should now descend to the "neckline" of the pattern before proceeding to break down below it and drop into the broad band of support shown as the dollar index ascends to its target in the 97 area, where silver should bottom out and turn up again as the dollar reverses to the downside having hit its target.

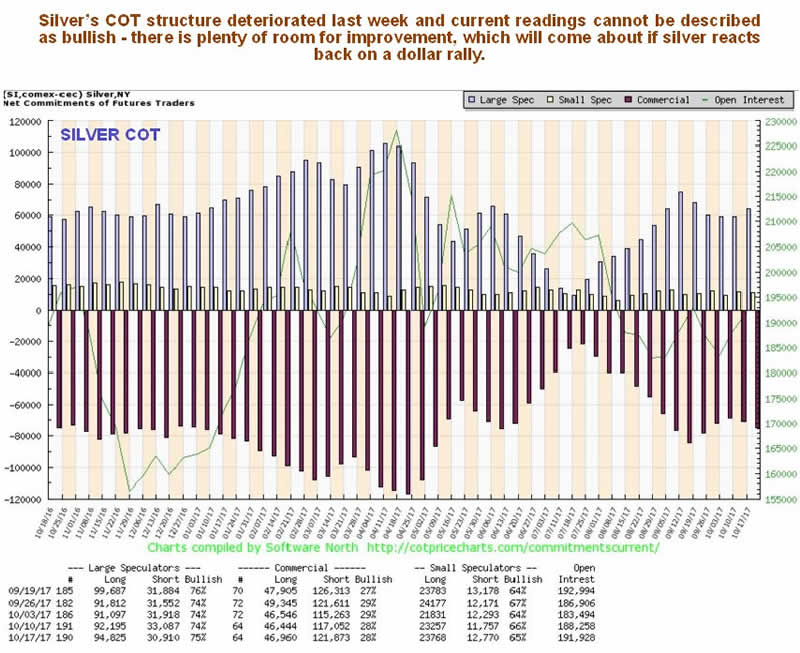
Although silver's recent COT charts cannot be described as bullish, they have looked better than those for gold, but this past week, unlike gold's, they took a turn for the worse. There is plenty of room for improvement here, which will be occasioned by silver breaking lower and dropping to the $16 area on a dollar rally.

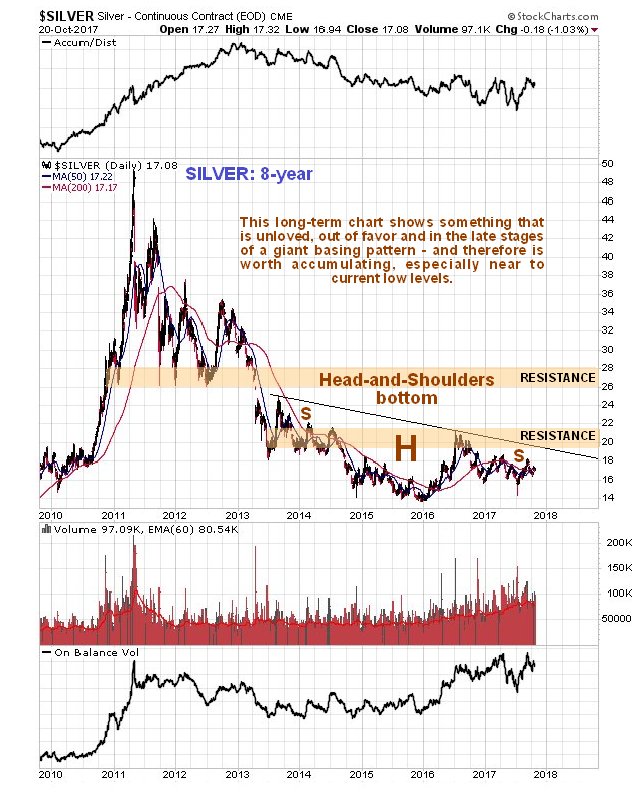
Like gold, silver is marking out a giant Head-and-Shoulders bottom pattern, but in silver’s case it is downsloping as we can see on its 8-year chart below, which reflects the fact that silver tends to underperform gold at the end of sector bear markets and during the early stages of sector bull markets. Prolonged underperformance by silver is therefore a sign of a bottom. This chart really does show how unloved silver is right now, but although the price has drifted slightly lower over the past several years, volume indicators have improved, especially this year, a positive sign. A break above the neckline of the pattern, the black line, will be a positive development, and more so a break above the band of resistance approaching the 2016 highs. Once it gets above this it will have to contend with a quite strong zone of resistance roughly between $26 and $28. Over the short to medium-term, however, as discussed above, silver is likely to first react back to the $16 area on a dollar rally.

Clive Maund has been president of www.clivemaund.com, a successful resource sector website, since its inception in 2003. He has 30 years' experience in technical analysis and has worked for banks, commodity brokers and stockbrokers in the City of London. He holds a Diploma in Technical Analysis from the UK Society of Technical Analysts.
Want to read more Gold Report articles like this? Sign up for our free e-newsletter, and you'll learn when new articles have been published. To see recent articles with industry analysts and commentators, visit our Streetwise Interviews page.
Disclosure:
1) Statements and opinions expressed are the opinions of Clive Maund and not of Streetwise Reports or its officers. Clive Maund is wholly responsible for the validity of the statements. Streetwise Reports was not involved in the content preparation. Clive Maund was not paid by Streetwise Reports LLC for this article. Streetwise Reports was not paid by the author to publish or syndicate this article.
2) This article does not constitute investment advice. Each reader is encouraged to consult with his or her individual financial professional and any action a reader takes as a result of information presented here is his or her own responsibility. By opening this page, each reader accepts and agrees to Streetwise Reports' terms of use and full legal disclaimer. This article is not a solicitation for investment. Streetwise Reports does not render general or specific investment advice and the information on Streetwise Reports should not be considered a recommendation to buy or sell any security. Streetwise Reports does not endorse or recommend the business, products, services or securities of any company mentioned on Streetwise Reports.
Charts provided by the author.
© 2005-2022 http://www.MarketOracle.co.uk - The Market Oracle is a FREE Daily Financial Markets Analysis & Forecasting online publication.


