


Gold Is In A Dangerous Spot
Commodities / Gold and Silver 2017 Oct 18, 2017 - 08:29 PM GMTBy: Avi_Gilburt

 Of late, I have seen many articles postulating what moves gold up or down. We have heard all the old reasons being put forth from GDP, to a hedge against market volatility to interest rates, to the US Dollar, and many more. Unfortunately, market history simply does not support these reasons as a consistent driver of gold, as I have detailed in many past articles:
Sentiment Speaks: Time To Buy Gold To Prepare For A Stock Market Crash?
In fact, a recent article on gold suggested that “[w]e all know that gold is negatively correlated to GDP growth.” Well, since gold rose between 2000-2008, and as you can see from this attached chart that REAL GDP did as well, are we really sure that we “all know that gold is negatively correlated to GDP growth?”
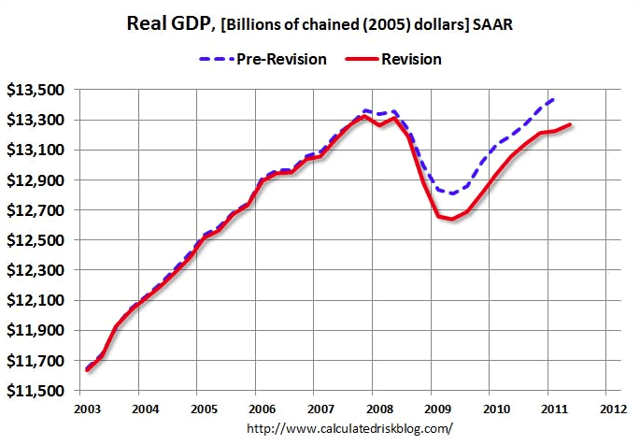
In fact, take note that the stock market also rose strongly during this same period of time. Moreover, I have seen many other charts presented which offer no evidence that there is any real relationship between gold and GDP.
I have discussed this many times in the past. Correlations cannot be wholly relied upon unless you understand when those seeming correlations will end. And, since most correlation analysis does not present any indication of when those correlations will end, they are no better than using a ruler to determine your projections for any chart.
Such linear analysis will be of no use in determining when a change of trend may occur. And, one does not need such analysis to assume the current trend for anything will continue. In fact, this is likely why so many intra-market analysts have done so poorly in the last 5 years as they failed to see the coming break down in the correlations they follow (even though we were warning about these impending break downs back in 2015).
Morgan Stanley: "We Haven't Seen A Shift This Severe In Over A Decade"
Price pattern sentiment indications and upcoming expectations
For those following us for the last six years, you would remember that we were not only accurate in our assessment for a top being struck in the metals complex in 2011, but we were also accurate in our assessment for a bottom being struck at the end of 2015.
Since that time, the market has provided us with what looks like a very nice 5-wave structure off the 2015 low, followed by a corrective pullback. Now, when I see a larger degree 5-wave structure (wave 1) being made off a multi-year bottom, followed by a corrective pullback (wave 2), I am on alert for the heart of a 3rd wave to take hold. And, in the metals complex, those are quite breathtaking rallies. For this reason, I have erred on the bullish side of the market as the market was looking like it was setting up for that 3rd wave in 2017.
However, rather than providing us the 3rd wave rally for which I was seeking confirmation, 2017 has been exceptionally frustrating as the market has invalidated several set-ups for that major 3rd wave break out.
Yet, when presented with the same opportunities on any chart, I would have probably reacted in the exact same fashion. Most of the time, the market will follow through on such set ups, while in a minority of circumstances we would see the market continue on a much larger degree 2nd wave pullback. Clearly, the market has decided that 2017 was going to be a year of consolidation.
Even though we have not had the 3rd wave break out, we have not yet broken any of the lows we identified throughout the year. And, for those that have heeded my warnings about not using leverage until the market proved itself to be within its 3rd wave, you could have still made money on each of these rallies. In fact, the GDX is approximately 10% over the lows we identified this year, even though it may not “feel” that way due to the frustration we have all felt with this current consolidation.
However, as I have been warning for the last few weeks, the GDX may be signaling it could break below those pullback lows we have struck this year. But, much depends on how high the rally I am expecting in the complex takes us.
If the GDX is able to make a higher high in the 26 region in the coming weeks, then it leaves the door open that green wave (2) may not break below the July lows. However, if the market is unable to develop a higher high over that struck in September, and then breaks below the low made before the current rally began, it opens the door to the GDX dropping down towards the 17 region before year end to complete a much more protracted wave ii, as presented in yellow on the daily GDX chart.
My preference still remains that GDX, silver and GLD all make a higher high in the coming weeks, which would put a more bullish stance upon the complex (even though another drop will likely take us into the end of the years), I really have nothing to which I can point that would suggest this will occur within a high degree of probability.
So, I have turned extremely cautious of the complex, at least until it proves itself with a higher high being struck in the coming weeks. Until such time, I am going to be more protective of my positions.
And for those who are still viewing this market from an extremely bullish perspective, I will be honest with you and tell you that I do not see any high probability set-up which would suggest the market is going to imminently break out in the heart of a 3rd wave just yet.
For this reason, I think that one can maintain a certain amount of patience (as if 2017 has not forced you to be patient enough), as even if we see a rally to a higher high, it will likely be followed by another pullback (as a wave (2) in GDX and a c-wave in GLD and silver) before we are finally ready to break out over the 2016 market highs.
Ultimately, this leads me to the conclusion that the 2016 market highs will not likely be broken until 2018, and this will remain as my primary expectation whether the GDX sees a larger break down or not. But, until we see how the next rally takes shape, we will not be able to ascertain with more certainty whether a bigger decline is in the cards into the end of the year, or if we will simply remain in the same consolidation region until then. But, caution for the next few months is clearly warranted.
See charts illustrating the wave counts on the GDX, GLD & Silver (YI).
Avi Gilburt is a widely followed Elliott Wave technical analyst and author of ElliottWaveTrader.net (www.elliottwavetrader.net), a live Trading Room featuring his intraday market analysis (including emini S&P 500, metals, oil, USD & VXX), interactive member-analyst forum, and detailed library of Elliott Wave education.
© 2017 Copyright Avi Gilburt - All Rights Reserved Disclaimer: The above is a matter of opinion provided for general information purposes only and is not intended as investment advice. Information and analysis above are derived from sources and utilising methods believed to be reliable, but we cannot accept responsibility for any losses you may incur as a result of this analysis. Individuals should consult with their personal financial advisors.
© 2005-2022 http://www.MarketOracle.co.uk - The Market Oracle is a FREE Daily Financial Markets Analysis & Forecasting online publication.