Stock Market Trading Dow Theory
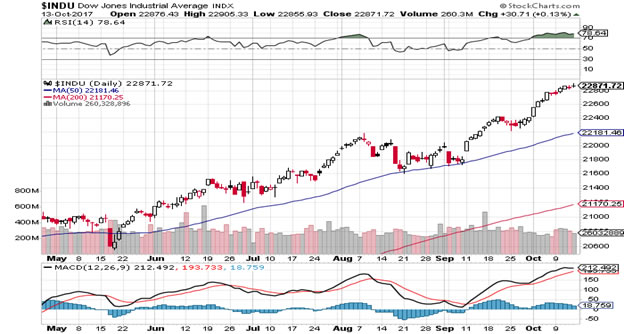
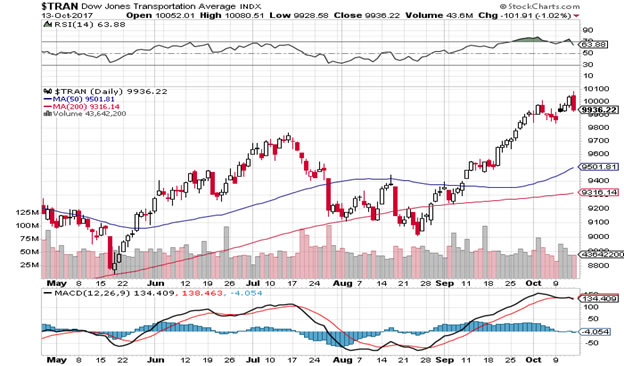
Stock-Markets / Stock Market 2017 Oct 16, 2017 - 06:19 PM GMT In the last Market Brief on the 1st October I outlined that the markets were now back on “full bull”. Since then the Dow Industrials have risen 466 points. The main reason I felt confident expressing this opinion was that while the Dow 30 had not experienced much of a pullback since mid-May (and therefore was very much “overbought”) the Dow Transports had corrected back to its 200 Daily Moving Average but was beginning to show renewed technical strength. This indicated that the main trend, as defined by the Dow Theory system, had remained in full force.
A number of readers have asked me to explain, in more detail, how such a “correct” technical call could be made. They had come to believe that one could not “trade” Dow Theory. Nothing could be further from the truth. In my experience if you can resolutely learn and apply Dow Theory you will discover the discipline to observe market trend, find it and stick with it. With Dow Theory will not trade often, maybe 2-3 times a year, but your trades will be super-profitable if you stick with the trend until technical correction occurs. This takes courage. In time you will discover that on average 7 out of 10 trades will be winners. If you progress in your trading to cut your losses early while letting your winners run, sometimes for months or even years, you will then have become a successful “Dow Theory Trader”.
This Dow Trading process was outlined brilliantly by Robert Rhea in his classic book “The Dow Theory” published in 1932. Regarding trading success rate he had this to say:
“The question is frequently asked, “What percentage of trades, timed in accordance with a reasonably competent interpretation of the Dow Theory, will be profitable?” It is the writer’s belief that any trader endowed with ordinary market sense and plenty of patience who has studied and used the averages as a guide through the complete cycle of a bull and bear market should be able to make at least 7 profitable turns out of every 10 efforts and each profitable trade should net a gain in excess of the loss on a trade improperly timed. ….Dow Traders do not watch the tape but play for the important movements and are not concerned with a few points loss or gain.”
For the record, a Dow Theory Trader uses 3 main rules:
Rule1. Dow Theory’s Three Market Price Movements.
There are three price movements in operation at one and the same time, in all markets. The first and most important trend is the primary one: the broad upward or downward movements, known as bull or bear markets. These main movements may be of several years duration. The second, and most deceptive movement, is the secondary reaction: an important decline in a primary bull market or a rally in a primary bear market. These reactions usually last from weeks to months. The third, and usually unimportant, is the daily or tertiary movement (tertiary = of third rank).
Rule 2. Determine the Trend.
Successive rallies penetrating high points, with ensuing declines terminating above preceding low points, offer a BULLISH indication.
Conversely, failure of rallies to penetrate previous high points, with ensuing declines carrying below former low points, is BEARISH.
Analysis of such price action is crucial in appraising secondary reactions and are of major importance in forecasting the resumption, continuation, or change of the primary trend.
A rally or a decline is defined as one or more daily movements resulting in a net reversal of direction exceeding three per cent of the price of either average. Such movements have little significance unless confirmed in direction by both averages, but the confirmation need not occur
on the same day.
Rule3. Wait For Both Averages To Confirm.
The movement of both the transport and industrial stocks averages should always be considered together. The movement of one price average must be confirmed by the other before reliable inferences may be drawn. Conclusions based upon the movement of one average, unconfirmed by the other, are almost certain to prove misleading.
Current Practical Application.
To reiterate, the main objective with regard to Dow Theory Trading is to “catch” the main trend and stick with it.
The current difficulty with this method of trading, for those folk who missed the current “Trump Rally”, is how to time a market entry, at a “risk reduced” point. Such a point occurred on the 21st September, as alluded to earlier, as indicated by the Dow Transport Index. This technical trigger worked as both the Dow Transports and the Dow Industrials must confirm a Dow Theory trend. (A trend, once signalled, continues until both indices confirm a change). The fact that the technical weakness was neutralised on the Trannies on that date indicated to seasoned Dow Theory traders that the current bull had gained technical re-confirmation and would, on probability, be “off to the races” again. And so it came to pass.
Unfortunately Dow Theory does not tell us how long a primary market trend will last. (The current bull is old, having commenced in March 2009) Thus while the market is extended, it still is showing powerful Dow Theory technical strength and shows no sign of weakening but that could change on a dime. For the record the Dow Transport index is the weaker of the two key indices so I would anticipate that this will be the first to signal change of primary trend.
However, if you are missing this “price action” do not “chase the market”. Instead, your task should be to wait for some degree of pull-back, on either of the averages. Once any technical weakness diminishes (and provided the bull trend is still “on”) then enter a long trade and stick with the primary trend it until it changes. If you are wrong, stop out and wait for a clearer signal.
Do not trade for random sake. This will result in trading failure. Thus the most important talents one must develop to succeed as a Dow Theory Trader are: disciplined observation, courage to act and stick with the trend, and patience, patience, patience.
Chart: Dow Industrials: Daily.

Chart: Dow Transports: Daily.

Charts: Courtesy of StockCharts.Com
Christopher Quiqley
B.Sc., M.M.I.I. Grad., M.A.
http://www.wealthbuilder.ie
Mr. Quigley was born in 1958 in Dublin, Ireland. He holds a Bachelor Degree in Accounting and Management from Trinity College Dublin and is a graduate of the Marketing Institute of Ireland. He commenced investing in the stock market in 1989 in Belmont, California where he lived for 6 years. He has developed the Wealthbuilder investment and trading course over the last two decades as a result of research, study and experience. This system marries fundamental analysis with technical analysis and focuses on momentum, value and pension strategies.
Since 2007 Mr. Quigley has written over 80 articles which have been published on popular web sites based in California, New York, London and Dublin.
Mr. Quigley is now lives in Dublin, Ireland and Tampa Bay, Florida.
© 2017 Copyright Christopher M. Quigley - All Rights Reserved
Disclaimer: The above is a matter of opinion provided for general information purposes only and is not intended as investment advice. Information and analysis above are derived from sources and utilising methods believed to be reliable, but we cannot accept responsibility for any trading losses you may incur as a result of this analysis. Individuals should consult with their personal financial advisors before engaging in any trading activities.
Christopher M. Quigley Archive |
© 2005-2022 http://www.MarketOracle.co.uk - The Market Oracle is a FREE Daily Financial Markets Analysis & Forecasting online publication.


