


Is U.S. Unemployment at the Bottom?
Economics / Unemployment Oct 14, 2017 - 02:52 PM GMTBy: Donald_W_Dony

The U.S. Unemployment rate and the markets have a direct opposite connection to each other. When one goes down (unemployment), the other (stock market) goes up.
The opposite is also true.
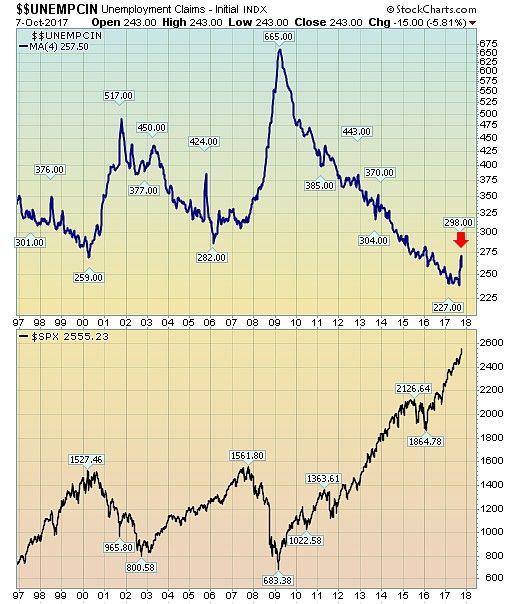
When the stock market (S&P 500) begins to rollover, the reverse action from the U.S. Unemployment rate is not far behind.
The action is simple to understand why.
When the stock market starts to correct, the first action company's usually takes is to reduce costs and keep their stock elevated. The easiest method of lowering a firm's expenses is to reduce their fixed costs (i.e. employees).
As a market correction starts to build and prolong, additional employees are laid-off. This action is multiplied by hundreds or thousands of companies all trying to keep the bottom line sincere and stock holders happy.
Normally the stock market leads the U.S. Unemployment rate by about six to 12 months.
As the present stock market remains buoyant (though overextended short-term), the current spike in the Unemployment rate would suggest that this movement is part of a bottoming process verses a start to a new upward trend. It is not necessarily a signal of a coming rollover in the markets. Brief upward movements can occur, as long as they are short-term.
Two examples are in 1998 and late 2005. Both spikes did not signal a sharp market decline. They were, however, within two years of a top.
Bottom Line: The recent upward spike in the U.S. Unemployment rate is only a concern if it remains elevated. Should it quickly fall back to 250,000 or less then there should be no alarm.
Our models for the markets continue to point toward higher levels over the next few months with a near-term target for the S&P 500 at 2575.
By Donald W. Dony, FCSI, MFTA
www.technicalspeculator.com
COPYRIGHT © 2017 Donald W. Dony
Donald W. Dony, FCSI, MFTA has been in the investment profession for over 20 years, first as a stock broker in the mid 1980's and then as the principal of D. W. Dony and Associates Inc., a financial consulting firm to present. He is the editor and publisher of the Technical Speculator, a monthly international investment newsletter, which specializes in major world equity markets, currencies, bonds and interest rates as well as the precious metals markets.
Donald is also an instructor for the Canadian Securities Institute (CSI). He is often called upon to design technical analysis training programs and to provide teaching to industry professionals on technical analysis at many of Canada's leading brokerage firms. He is a respected specialist in the area of intermarket and cycle analysis and a frequent speaker at investment conferences.
Mr. Dony is a member of the Canadian Society of Technical Analysts (CSTA) and the International Federation of Technical Analysts (IFTA).
Donald W. Dony Archive |
© 2005-2022 http://www.MarketOracle.co.uk - The Market Oracle is a FREE Daily Financial Markets Analysis & Forecasting online publication.