


Stock Market as Good as it Gets; Like 2000 With a Twist
Stock-Markets / Stock Market 2017 Oct 06, 2017 - 02:27 AM GMTBy: Gary_Tanashian

 With the Semiconductor sector below but hailing its all-time highs, a lot of images come to mind; chief among them the 1999-2000 stock market bubble…
In early 2013 we noted a progression that would go on to birth the current economic expansion and stock market boom (of course, I didn’t come close to envisioning the extent of the boom that followed). I’ve belabored it often since, but here’s the short version of the progression yet again…
Fiscal Cliff drama resolves into market relief after Q4 2012 and this occurs right around the time we noted that Semiconductor Fab equipment bookings were ramping up → which projected a ramp in the cyclical Semiconductor industry → which would lead general manufacturing → which projected broader economic firming → which projected improving employment → and with ISM currently booming and the Semi cycle in full swing, voila, we are still on that continuum.
Speaking of which, and considering I am not one for subtlety, here’s the Continuum again so you have a cartoon to consider while digesting the rest of this post.
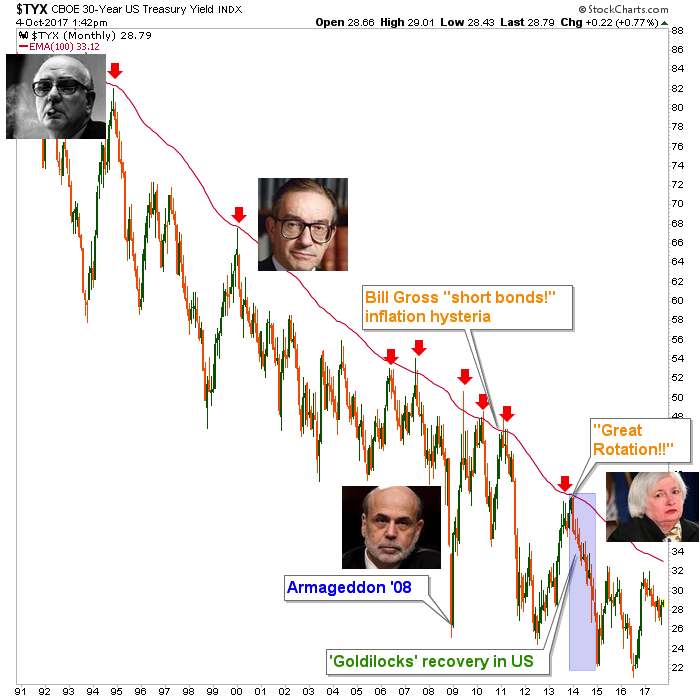
The Semiconductor cycle was born in 2013 just before long-term Treasury yields topped out into the climax of the Great Promotion Rotation hype that the financial media cooked up as a rationale for buying stocks. It turned out they did not need hype because over valuation and over speculation aside, the cycle was real and backed by firm economic activity.
But it was a Goldilocks recovery and to this very day the bond market has not changed its mind about that. If the backbone of the chart above (the red EMA 100) remains intact, the continuum… continues. We’ll return to the bond market a bit later in the post with some reasoning about why Janet Yellen or whoever replaces her may not be as lucky as the middle two mugs on the chart above.
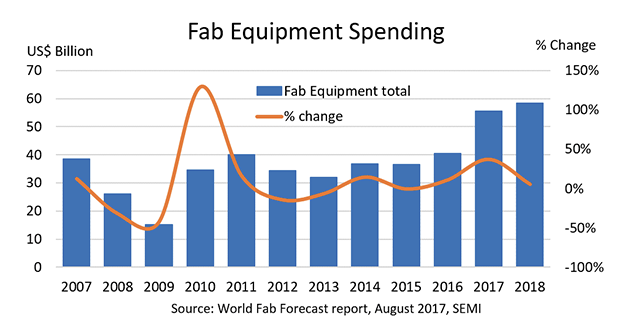
So here we are nearly 5 years later and Semi Fab spending for 2017 has been robust and is projected the same for 2018. I’d tend to dismiss these projections as trend following happy talk as I would the average economist’s projections, but in this case SEMI is charged with being accurate for industry users, not with running promotions upon we financial sphere types* looking for macro signals. Ever since we got the lift off signal in January of 2013 I’ve watched closely to see if the rosy projections might be hype and all along they’ve been borne out. The only crack in the rose colored glasses is that the rate of change has faded from what is in essence the 2017 actual to the 2018 projection. It’s hardly a concern in and of itself.
Moving on to what would be the next step from a firming Semi cycle, manufacturing is brisk all these years later (although Callum Thomas points out a discrepancy between the Markit and ISM PMIs).

If ISM (which I trust as a data source) is right the signal is as good as it gets for the manufacturing sectors. However, a casual glance at respondents’ overall healthy view (ISM Report for September) shows that the recent Hurricanes factored quickly and heavily into pricing in the supply chain.
Headline PMI really does not mean much. New Orders and Employment are solid and backlogs are good too. The rest is noise factoring into the headline PMI. It’s a solid report but I saw a lot of financial media buzzing about the Prices reading at 71.50. Tune it out. It’s not going to create inflation or inject anything structural into the economic situation.
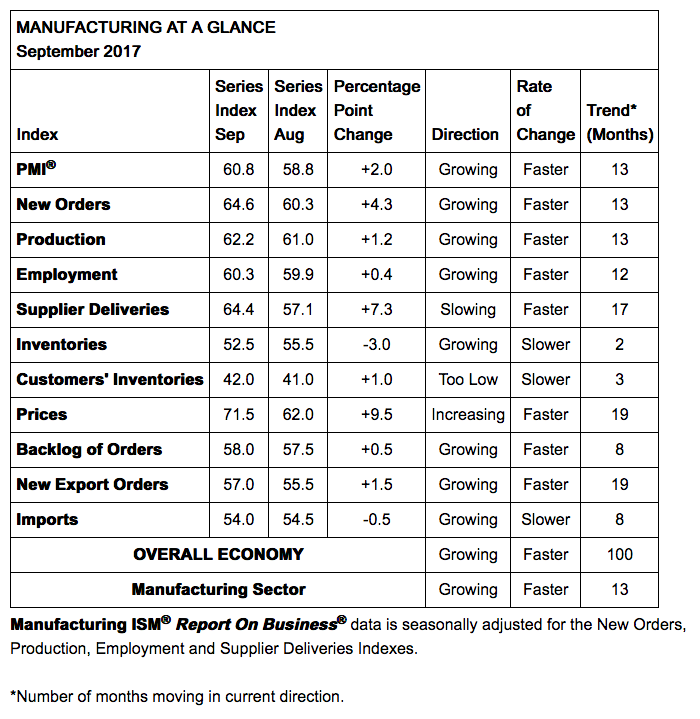
The ISM’s bottom line however, is that the readings were firm in August as well and if inflation expectations start to creep up and large financial interests and global sovereign Treasury bond holders become net sellers… inflation would be indicated. It could be a good old fashioned inflation like the post-2000 period, which has so many similarities to today (like a potential market blow off).
But with the Fed soon to be actively, albeit slowly, removing assets from its balance sheet as a remedy to Ben Bernanke’s decidedly over the top original actions, a wild card is in the mix that did not exist in 2000 on through the inflationary bull market overseen by Alan Greenspan. In that time frame, despite obvious inflation in the system, the bond market remained tame (as one look at that time frame on the 30yr Continuum above clearly shows) and supportive. After post-2008 unconventional policy was fire hosed in there must be distortions, the effects of which we have not yet felt.
After 2000, from low long-term Treasury yields the great credit/mortgage bubble was blown in reaction to the stresses in and around 2001. This then instigated mal-investment in the housing and mortgage markets, mal-pricing in the housing market and in a progression much uglier than the Semi cycle noted at the beginning of this post, eventually proceeded into new leveraged derivative products and vehicles by which Wall Street banks almost wrecked the financial system. Their salespeople sucked in not only gullible and unqualified home buyers, not only US institutions and municipalities, but institutions and investment entities all over the world. All due to the speculation that resulted from inflation-by-policy (i.e. money printing) permitted by low Treasury yields and the supposed “inflation vigilantes” that may in hindsight have been more myth than reality.
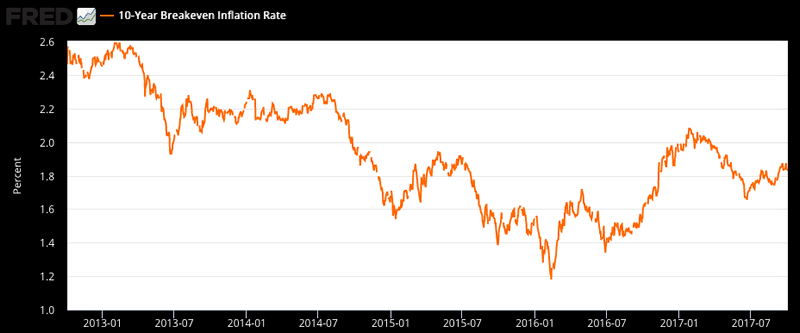
So we are left watching ‘inflation expectations’ signals from the bond market (still tame) and economic indicators in order to gauge how well the Fed is doing at boosting inflation. Dumping long-term Treasury bonds, if not regulated well, could eventually work to paint the macro in an opposite way that Operation Twist did. Maybe now this macro operation would paint inflation in, as opposed to Op/Twist’s goal of sanitizing it out of the system.
Again, the goal of Twist was to buy long-term bonds and sell short-term bonds, to force a flattening yield curve and hold long-term interest rates down. Enter the Goldilocks economy, as if by decree. But today the Fed is on the verge of doing the opposite, albeit slowly. They plan to sell long-term instruments back into the market while at the same time economic growth is brisk.
Nothing is a lock here in Wonderland, but with the world conditioned for decades by the secular decline in yields, what if the red line on the first chart above is taken out (above 3.3%), the bond bull ends and all bets currently aligned with the secular bond bull (yield decline) come off?
Bottom Line
We have a lot of similarities to 2000 except that back then Greenspan had the benefit of low yields, which provided the mechanics of the recovery (i.e. the credit bubble and inflationary bull market, which later melted down into the first “Great Recession”).
Today we have a market that has feasted off of the Goldilocks environment that was created by QEs 1-3 and a Twisted operation of brilliance by Ben Bernanke, the “hero”, who will have long since ridden off into the sunset.
Investment and risk management objectives would include some important dos and don’ts depending on what the Treasury bond market and the Continuum above, do. Be prepared with an open mind that considers a view of decades as opposed to days, weeks, months or years.
* Of course I’m not really a financial type. I don’t wear fancy suits and I’ve spent more years on a manufacturing shop floor than in my home office writing about markets (which at 13 years and counting is getting pretty long too).
Subscribe to NFTRH Premium for your 40-55 page weekly report, interim updates and NFTRH+ chart and trade ideas or the free eLetter for an introduction to our work. Or simply keep up to date with plenty of public content at NFTRH.com and Biiwii.com. Also, you can follow via Twitter ;@BiiwiiNFTRH, StockTwits, RSS or sign up to receive posts directly by email (right sidebar).
By Gary Tanashian
© 2017 Copyright Gary Tanashian - All Rights Reserved
Disclaimer: The above is a matter of opinion provided for general information purposes only and is not intended as investment advice. Information and analysis above are derived from sources and utilising methods believed to be reliable, but we cannot accept responsibility for any losses you may incur as a result of this analysis. Individuals should consult with their personal financial advisors.
Gary Tanashian Archive |
© 2005-2022 http://www.MarketOracle.co.uk - The Market Oracle is a FREE Daily Financial Markets Analysis & Forecasting online publication.