


Will Crude Oil Drop under $50 in Coming Week?
Commodities / Crude Oil Oct 03, 2017 - 04:05 PM GMTBy: Nadia_Simmons

 Although the price of black gold increased a bit on Friday, the commodity closed the whole week below important resistance lines and invalidated earlier breakouts. What does it mean for crude oil?
Crude Oil’s Technical Picture
Let’s take a closer look at the charts below and find out (charts courtesy of http://stockcharts.com).
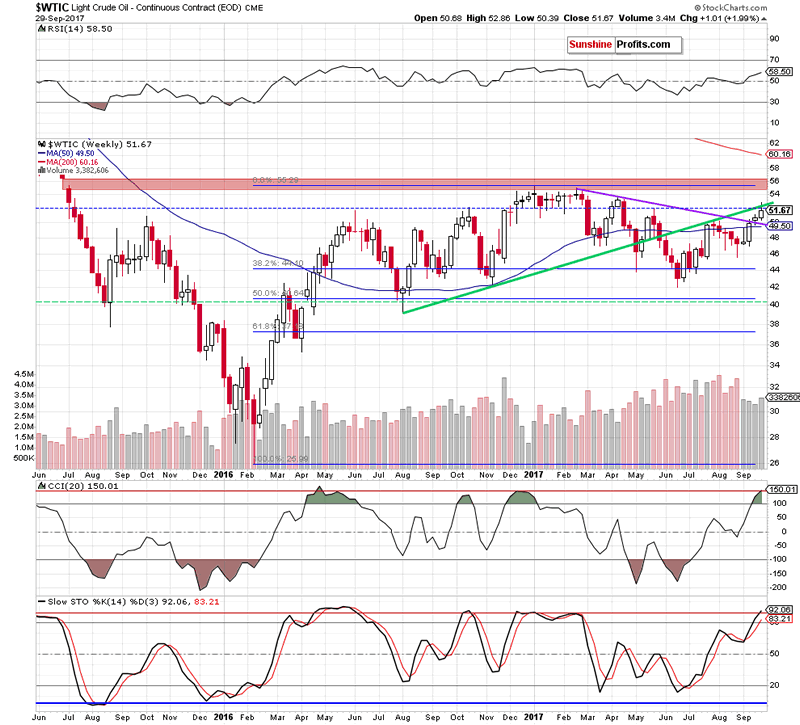
On Friday, we wrote that the first thing that catches the eye on the medium-term chart is an invalidation of the breakout above the long-term green resistance line. Additionally, thanks to yesterday’s drop the commodity slipped under the previously-broken May peak (marked with the blue horizontal dashed line), invalidating the earlier tiny breakout, which is a negative development. Nevertheless, these events will turn into bearish if we see a weekly closure below them later in the day.
From today’s point of view, we see that the commodity closed the previous week under the long-term green resistance line, invalidating earlier breakouts and giving oil bears an important reason to act in the coming week.
How did this drop affect the very short-term chart? Let’s check.
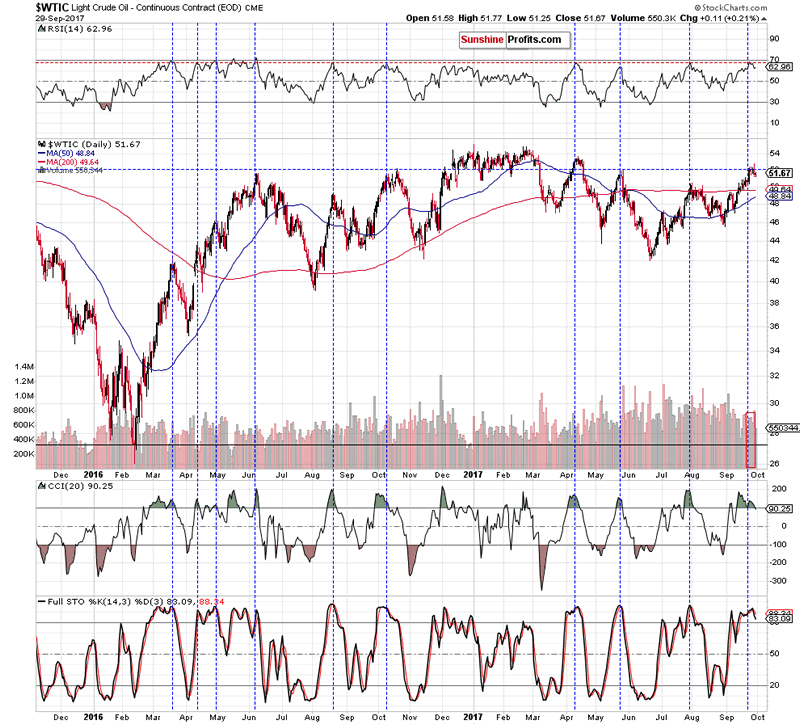
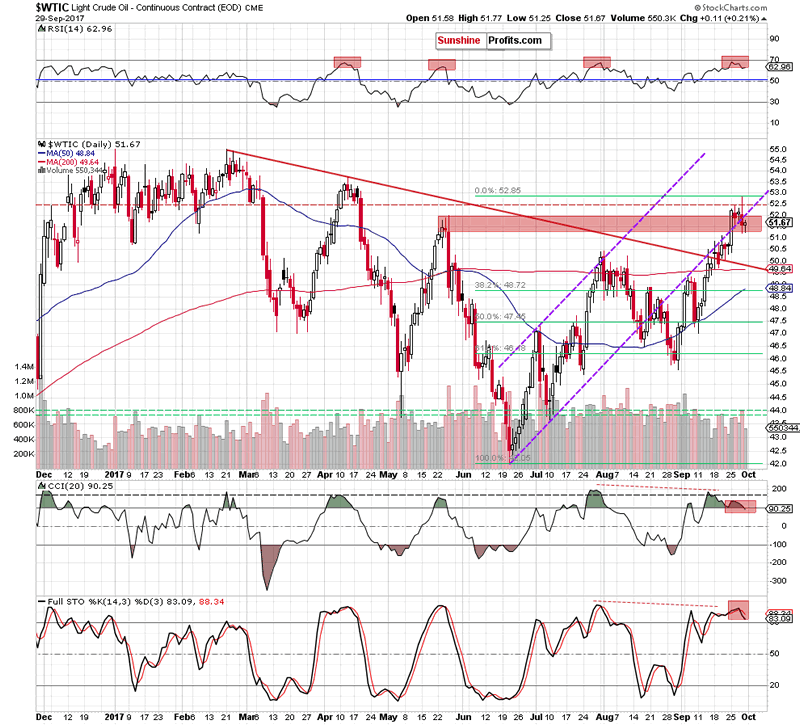
On the daily chart, we see that although crude oil moved a bit higher on Friday, the size of rebound was small compared to Thursday pullback. Additionally it materialized on visibly lower volume than earlier decline, which increases doubts about oil bulls’ strength and further rally.
On top of that, crude oil closed another session and the whole week below the recent highs and the previously-broken lower border of the purple rising trend channel, which together with the sell signals generated by the CCI and the Stochastic Oscillator suggests further deterioration in the coming week.
How low could crude oil go?
If this is the case and crude oil declines from current levels, the initial downside target for oil bears will be around $49.85, where the previously-broken red declining line (which serves as the nearest support) is. If it’s broken, we’ll likely see a drop to the 38.2% Fibonacci retracement based on the June-September upward move (around $48.72) in the following days.
Finishing today’s alert please note that Friday Baker Hughes report showed that the number of oil rig rose by 6 to 750 after declining for four of the previous five weeks. In our opinion, this is a negative signal, which will likely increase concerns that U.S. oil output could rebound and push the price of light crude lower in the coming days. This pro bearish scenario is also reinforced by news that OPEC crude oil output increased in the previous month because of higher supplies from Iraq and Libya. Therefore, we believe that short positions continue to be justified from the risk/reward perspective.
Summing up, short positions continue to be justified from the risk/reward perspective as the combination of the technical (invalidation of breakouts, higher volume during declines, sell signals generated by the indicators) and the fundamental pictures (an increase in the number of oil rig, higher production from Iraq and Libya) of the commodity suggest lower prices in the coming week.
If you enjoyed the above analysis and would like to receive free follow-ups, we encourage you to sign up for our daily newsletter – it’s free and if you don’t like it, you can unsubscribe with just 2 clicks. If you sign up today, you’ll also get 7 days of free access to our premium daily Oil Trading Alerts as well as Gold & Silver Trading Alerts. Sign up now.
Thank you.
Nadia Simmons
Forex & Oil Trading Strategist
Przemyslaw Radomski
Founder, Editor-in-chief
Sunshine Profits: Gold & Silver, Forex, Bitcoin, Crude Oil & Stocks
Stay updated: sign up for our free mailing list today
* * * * *
Disclaimer
All essays, research and information found above represent analyses and opinions of Nadia Simmons and Sunshine Profits' associates only. As such, it may prove wrong and be a subject to change without notice. Opinions and analyses were based on data available to authors of respective essays at the time of writing. Although the information provided above is based on careful research and sources that are believed to be accurate, Nadia Simmons and his associates do not guarantee the accuracy or thoroughness of the data or information reported. The opinions published above are neither an offer nor a recommendation to purchase or sell any securities. Nadia Simmons is not a Registered Securities Advisor. By reading Nadia Simmons’ reports you fully agree that he will not be held responsible or liable for any decisions you make regarding any information provided in these reports. Investing, trading and speculation in any financial markets may involve high risk of loss. Nadia Simmons, Sunshine Profits' employees and affiliates as well as members of their families may have a short or long position in any securities, including those mentioned in any of the reports or essays, and may make additional purchases and/or sales of those securities without notice.
© 2005-2022 http://www.MarketOracle.co.uk - The Market Oracle is a FREE Daily Financial Markets Analysis & Forecasting online publication.