Stock Market Bounce Stops at Resistance
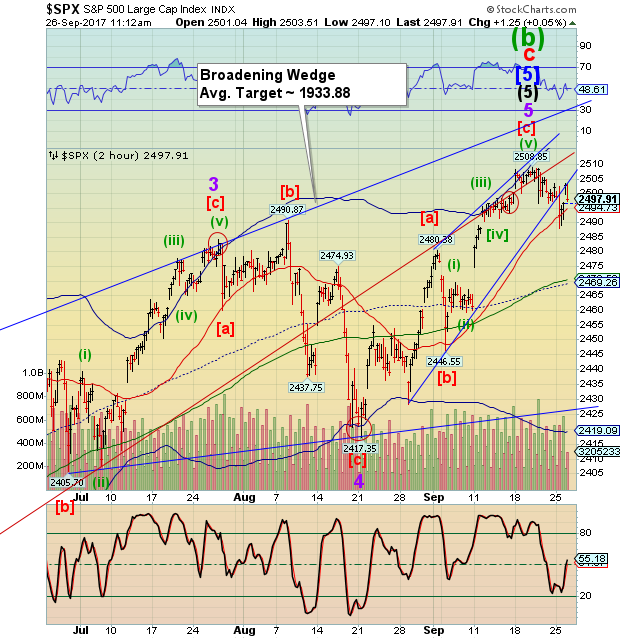
Stock-Markets / Stock Market 2017 Sep 26, 2017 - 03:44 PM GMT SPX has apparently been stopped at the Ending Diagonal trendline. The oversold condition has been relieved enough to allow the decline to resume. Should it continue, it is likely to be a complex affair, as it has been so far. As mentioned earlier, the next support appears to be the 50-day Moving Average at 2470.53. But that may not be all. The overlap suggests the decline is nowhere near being finished, so don’t be surprised if the decline starts to accelerate..

ZeroHedge reports, “The Conference Board's Consumer Confidence measure for September disappointex expectations with both current and future indices dropping (the former more than the latter).
Differences across regions are very notable as storms impacted confidence...
However, what is most concerning (for the powers-that-be), is the plunge in faith that the stock market will go higher...

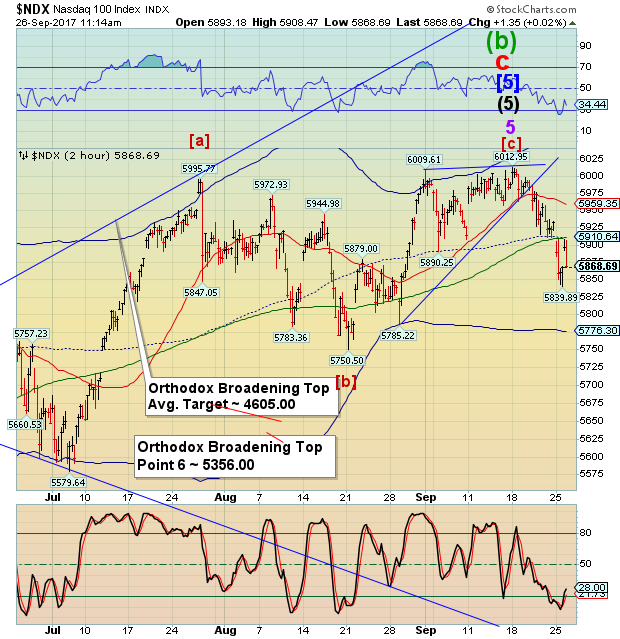
The NDX rallied short of its 50-day Moving Average at 5910.68. In addition it hasn’t overlapped with a lesser degree Wave (i) at 5915.74. This gives the decline “permission” to continue as an impulse. Impulsive Waves decline in 5, 9, 13, 17, etc. Wave segments. One can easily see five waves, so the next extension may give it 9 Waves and potentially reach the Cycle Bottom at 5776.63, as a minimum.
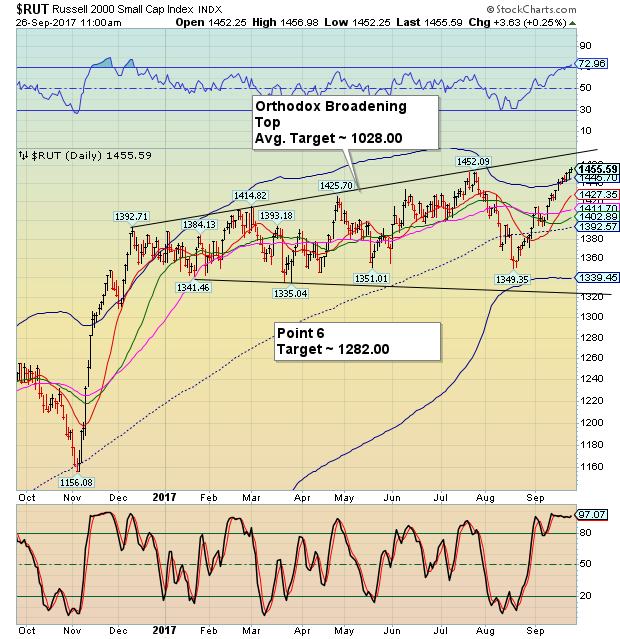
The Russell 2000 appears to be completing “point 9” in what is usually referred to as a 5-point reversal. This indicates the influence of the Central Banks that have started buying small cap stocks this year after taking majority positions in many large cap companies. In fact, The Bank of Japan owns such a large share of the Nikkei that there is some concern about their capability of nationalizing the market. The RUT Cycles usually closely track the SPX Cycles, but with varying intensity, as you can see.

We may expect to see the RUT turn down at the top of this bounce in the SPX today. This accounts for the 4-day lag between the two indices.

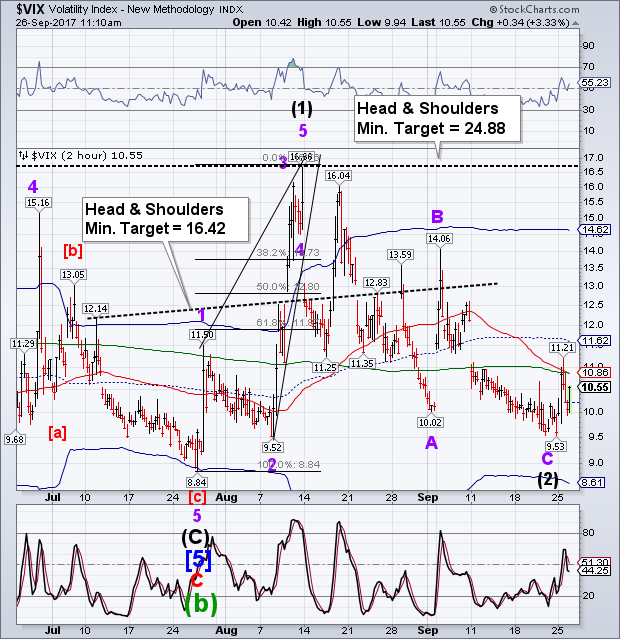
The VIX is back in positive territory after its morning pullback. The VIX buy signal (SPX sell signal) occurs at the crossing of the Short-term and 50-day resistance at 10.86.
Regards,
Tony
Our Investment Advisor Registration is on the Web.
We are in the process of updating our website at www.thepracticalinvestor.com to have more information on our services. Log on and click on Advisor Registration to get more details.
If you are a client or wish to become one, please make an appointment to discuss our investment strategies by calling Connie or Tony at (517) 699-1554, ext 10 or 11. Or e-mail us at tpi@thepracticalinve4stor.com .
Anthony M. Cherniawski, President and CIO http://www.thepracticalinvestor.com
As a State Registered Investment Advisor, The Practical Investor (TPI) manages private client investment portfolios using a proprietary investment strategy created by Chief Investment Officer Tony Cherniawski. Throughout 2000-01, when many investors felt the pain of double digit market losses, TPI successfully navigated the choppy investment waters, creating a profit for our private investment clients. With a focus on preserving assets and capitalizing on opportunities, TPI clients benefited greatly from the TPI strategies, allowing them to stay on track with their life goals.
Disclaimer: The content in this article is written for educational and informational purposes only. There is no offer or recommendation to buy or sell any security and no information contained here should be interpreted or construed as investment advice. Do you own due diligence as the information in this article is the opinion of Anthony M. Cherniawski and subject to change without notice.
Anthony M. Cherniawski Archive |
© 2005-2022 http://www.MarketOracle.co.uk - The Market Oracle is a FREE Daily Financial Markets Analysis & Forecasting online publication.


