


Top 3 Technical Trading Tools Part 3: MACD
InvestorEducation / Learn to Trade Sep 07, 2017 - 08:19 PM GMTBy: EWI

 "Guessing or going by gut instinct won't work over the long run. If you don't have a defined trading methodology, then you don't have a way to know what constitutes a buy or sell signal. Moreover, you can't even consistently correctly identify the trend."
Jeffrey Kennedy is an accomplished teacher and a Senior Analyst here at Elliott Wave International. He feels strongly that, in addition to risk management and emotional discipline, the right technical tools can also add confidence and clarity to your Elliott wave counts.
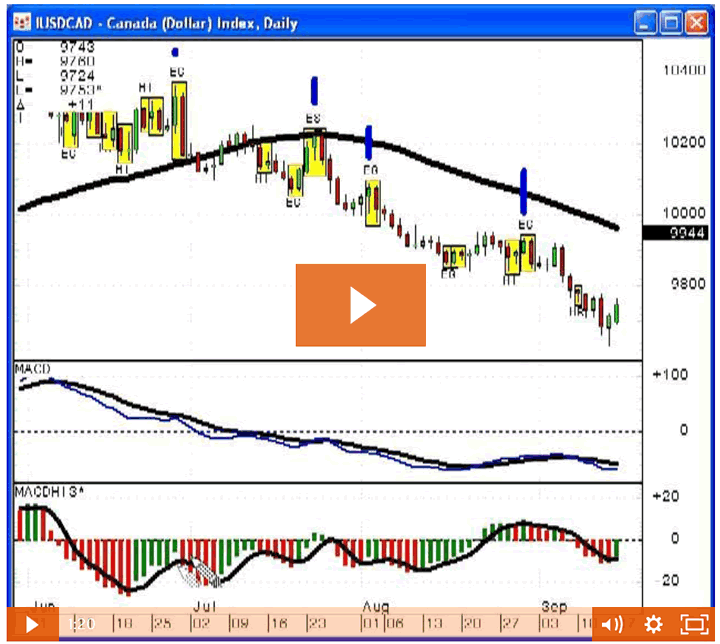
Jeffrey's 3 favorite technical tools are Japanese Candlesticks, RSI (Relative Strength Index) and MACD (Moving Average Convergence-Divergence). Today's lesson shows you how MACD can help identify trading opportunities with an example from USDCAD, the U.S. dollar vs. Canadian dollar.
This video is an overview of MACD. It was adapted from Jeffrey's Trader's Classroom educational service, which empowers subscribers with information on nearly every aspect of trading.
More from Jeffrey:
Moving average convergence divergence (MACD) is a momentum indicator developed by Gerald Appel. It consists of two exponential moving averages, the MACD line and Signal line. The difference between these two lines yields an additional indicator, MACD Histogram.
Since these studies evaluate momentum, they work optimally in trending markets. When combined with reversal candlestick patterns, MACD and MACD Histogram can increase confidence in these patterns as well as continuation of the larger trend.
MACD divergence occurs when prices move one way and MACD moves the other. Bearish divergence forms when prices make new highs and MACD does not. Conversely, new price lows without lower MACD readings is bullish divergence. These conditions aid traders in identifying potential changes in momentum and trend.
MACD is constructed using two lines referred to as the MACD line and the Signal line. When the MACD line appears to penetrate the Signal line, but fails to do so, a hook forms. The significance of a hook is that it coincides with countertrend price moves.
MACD is excellent technical tool provided you know how to use it and what to look for.
Learn How You Can Find High-Confidence Trading Opportunities Using Moving AveragesMoving averages are one of the most widely-used methods of technical analysis because they are simple to use, and they work. Learn how to apply them to your trading and investing with this free 10-page eBook from Trader's Classroom editor Jeffrey Kennedy. |
This article was syndicated by Elliott Wave International and was originally published under the headline Top 3 Technical Tools Part 3: MACD. EWI is the world's largest market forecasting firm. Its staff of full-time analysts led by Chartered Market Technician Robert Prechter provides 24-hour-a-day market analysis to institutional and private investors around the world.
© 2005-2022 http://www.MarketOracle.co.uk - The Market Oracle is a FREE Daily Financial Markets Analysis & Forecasting online publication.