


4 Charts Show Why You Should Run Away From The Stock Market S&P 500
Stock-Markets / Stock Market 2017 Aug 25, 2017 - 11:42 AM GMTBy: John_Mauldin

 BY JOHN MAULDIN : My friend James Montier, now at GMO, and his associate Matt Kadnar have written a compelling piece on why passive investors should avoid the S&P 500.
Their essay argues that the forward growth potential of the S&P 500 is significantly lower than that of other opportunities, especially emerging markets.
Let’s look at a few of their charts.
For the Next 7 Years, S&P 500 Returns Will be a Negative 3.9%
The chart above breaks the total return from the beginning of the current bull market in the S&P 500 into its four main components: increasing multiples, margin expansion, growth, and dividends.
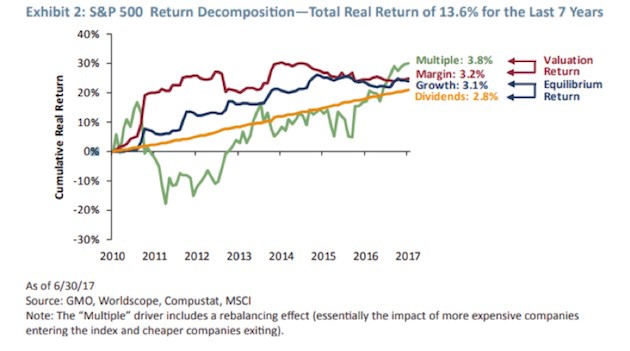
He notes that this total return is more than double the level of long-term real return growth since 1970.
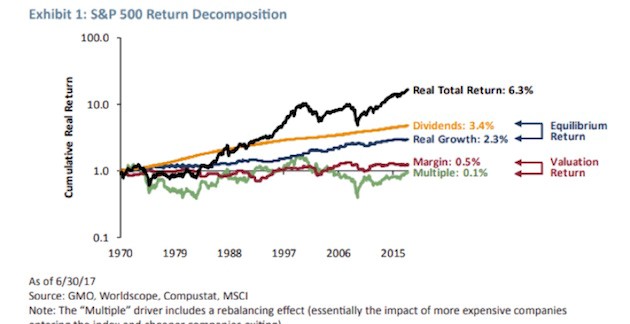
If earnings and dividends are remarkably stable (and they are), to believe that the S&P will continue delivering the wonderful returns we have experienced over the last seven years is to believe that P/Es and margins will continue to expand just as they have over the last seven years. The historical record for this assumption is quite thin, to put it kindly. It is remarkably easy to assume that the recent past should continue indefinitely, but it is an extremely dangerous assumption when it comes to asset markets. Particularly expensive ones, as the S&P 500 appears to be.
More bluntly put, the historical record supporting this assumption is non-existent. It never happened. Just saying…
The authors then describe how they build their seven-year forecasts of S&P 500 returns.
They argue that for the next seven years, returns will be a negative 3.9%. Note that GMO is not a perma-bear money-management business. Their forecasts were extremely bullish in February 2009.
They are a valuation shop, pure and simple. Investors—typically large institutions and pension funds—that are leaving Grantham’s management firm now are going to regret it. The consultants or managers who suggested that move are going to need to polish their résumés.
No Good Options Are Left
The bottom line? “The cruel reality of today’s investment opportunity set is that we believe there are no good choices from an absolute viewpoint—that is, everything is expensive (see the chart below).”
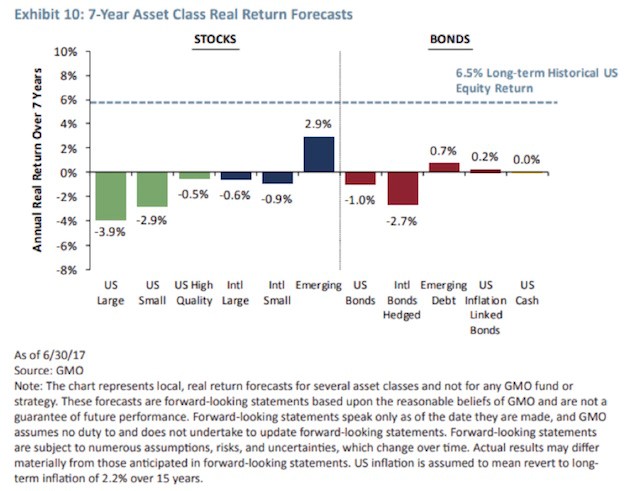
For a relative investor (following the edicts of value investing), we believe the choice is clear: Own as much international and emerging market equity as you can and as little US equity as you can. If you must own US equities, we believe Quality is very attractive relative to the market. While Quality has done well versus the US market, long international and emerging versus the US has been a painful position for the last few years, but it couldn’t be any other way. Valuation attractiveness is generally created by underperformance (in absolute and/or relative terms). As Keynes long ago noted, a valuation-driven investor is likely seen as “eccentric, unconventional, and rash in the eyes of average opinion.” [Emphasis mine.]
In absolute terms, the opportunity set is extremely challenging. However, when assets are priced for perfection as they currently are, it takes very little disappointment to lead to significant shifts in the pricing of assets. Hence, our advice (and positioning) is to hold significant amounts of dry powder, recalling the immortal advice of Winnie-the-Pooh, “Never underestimate the value of doing nothing” or, if you prefer, remember—when there is nothing to do, do nothing.
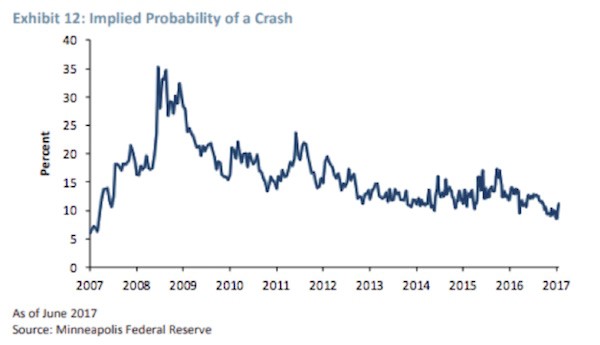
Markets appear to be governed by complacency at the current juncture. Indeed, looking at the options market, it is possible to imply the expected probability of a significant decline in asset prices. According to the Minneapolis Federal Reserve, the probability of a 25% or greater decline in US equity prices occurring over the next 12 months implied in the options market is only around 10% (see Exhibit 12). Now, we have no idea what the true likelihood of such an event is, but when faced with the third most expensive US market in history, we would suggest that 10% seems very low.
Those are wise words indeed.
Get one of the world’s most widely read investment newsletters… free
Sharp macroeconomic analysis, big market calls, and shrewd predictions are all in a week’s work for visionary thinker and acclaimed financial expert John Mauldin. Since 2001, investors have turned to his Thoughts from the Frontline to be informed about what’s really going on in the economy. Join hundreds of thousands of readers, and get it free in your inbox every week.
John Mauldin Archive |
© 2005-2022 http://www.MarketOracle.co.uk - The Market Oracle is a FREE Daily Financial Markets Analysis & Forecasting online publication.