Most Popular
1. It’s a New Macro, the Gold Market Knows It, But Dead Men Walking Do Not (yet)- Gary_Tanashian
2.Stock Market Presidential Election Cycle Seasonal Trend Analysis - Nadeem_Walayat
3. Bitcoin S&P Pattern - Nadeem_Walayat
4.Nvidia Blow Off Top - Flying High like the Phoenix too Close to the Sun - Nadeem_Walayat
4.U.S. financial market’s “Weimar phase” impact to your fiat and digital assets - Raymond_Matison
5. How to Profit from the Global Warming ClImate Change Mega Death Trend - Part1 - Nadeem_Walayat
7.Bitcoin Gravy Train Trend Forecast 2024 - - Nadeem_Walayat
8.The Bond Trade and Interest Rates - Nadeem_Walayat
9.It’s Easy to Scream Stocks Bubble! - Stephen_McBride
10.Fed’s Next Intertest Rate Move might not align with popular consensus - Richard_Mills
Last 7 days
Friday Stock Market CRASH Following Israel Attack on Iranian Nuclear Facilities - 19th Apr 24
All Measures to Combat Global Warming Are Smoke and Mirrors! - 18th Apr 24
Cisco Then vs. Nvidia Now - 18th Apr 24
Is the Biden Administration Trying To Destroy the Dollar? - 18th Apr 24
S&P Stock Market Trend Forecast to Dec 2024 - 16th Apr 24
No Deposit Bonuses: Boost Your Finances - 16th Apr 24
Global Warming ClImate Change Mega Death Trend - 8th Apr 24
Gold Is Rallying Again, But Silver Could Get REALLY Interesting - 8th Apr 24
Media Elite Belittle Inflation Struggles of Ordinary Americans - 8th Apr 24
Profit from the Roaring AI 2020's Tech Stocks Economic Boom - 8th Apr 24
Stock Market Election Year Five Nights at Freddy's - 7th Apr 24
It’s a New Macro, the Gold Market Knows It, But Dead Men Walking Do Not (yet)- 7th Apr 24
AI Revolution and NVDA: Why Tough Going May Be Ahead - 7th Apr 24
Hidden cost of US homeownership just saw its biggest spike in 5 years - 7th Apr 24
What Happens To Gold Price If The Fed Doesn’t Cut Rates? - 7th Apr 24
The Fed is becoming increasingly divided on interest rates - 7th Apr 24
The Evils of Paper Money Have no End - 7th Apr 24
Stock Market Presidential Election Cycle Seasonal Trend Analysis - 3rd Apr 24
Stock Market Presidential Election Cycle Seasonal Trend - 2nd Apr 24
Dow Stock Market Annual Percent Change Analysis 2024 - 2nd Apr 24
Bitcoin S&P Pattern - 31st Mar 24
S&P Stock Market Correlating Seasonal Swings - 31st Mar 24
S&P SEASONAL ANALYSIS - 31st Mar 24
Here's a Dirty Little Secret: Federal Reserve Monetary Policy Is Still Loose - 31st Mar 24
Tandem Chairman Paul Pester on Fintech, AI, and the Future of Banking in the UK - 31st Mar 24
Stock Market Volatility (VIX) - 25th Mar 24
Stock Market Investor Sentiment - 25th Mar 24
The Federal Reserve Didn't Do Anything But It Had Plenty to Say - 25th Mar 24

Market Oracle FREE Newsletter

How to Protect your Wealth by Investing in AI Tech Stocks

AUDUSD Rebounded From Trend Line Support

Currencies / Austrailia Aug 19, 2017 - 06:42 PM GMT

By: Franco_Shao

Currencies

AUDUSD rebounded strongly to 0.7960 area after approaching the bullish trend line on its daily chart, suggesting that the pair remains in the uptrend from 0.7328 and the pullback from 0.8065 could be treated as consolidation of the uptrend.


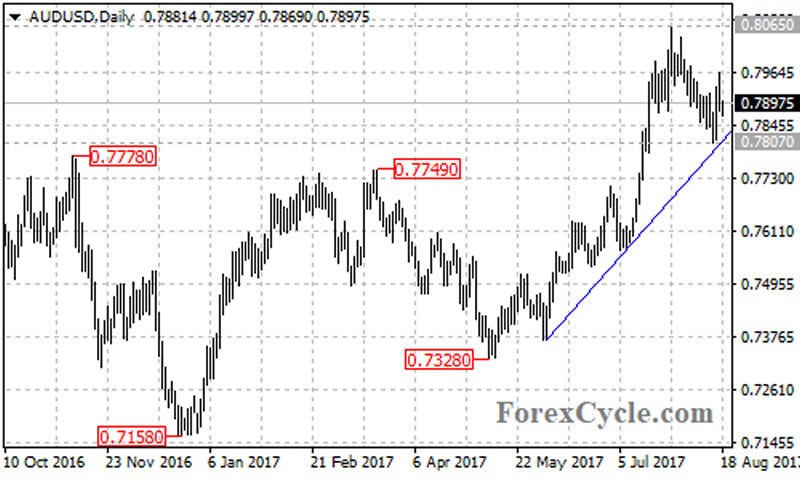
As long as the price is above the bullish trend line, the uptrend from 0.7328 could be expected to resume and another rise towards the May 2015 high of 0.8162 is possible after the consolidation.

On the 4-hour chart, the AUDUSD pair recently broke above a bearish price channel at 0.7890, indicating that the downside movement from 0.8065 had completed at 0.7807 already. The pair is now in short term uptrend from 0.7807, the fall from 0.7962 could be treated as correction of the uptrend. A break above 0.7962 resistance could take price to the next resistance level at 0.8065, above this level will signal resumption of the uptrend from 0.7328.

The key support is located at 0.7807, only a breakdown below this level will confirm that the bullish move from 0.7328 had completed at 0.8065 already, then the following downside move could bring price to test the next support level at 0.7700.


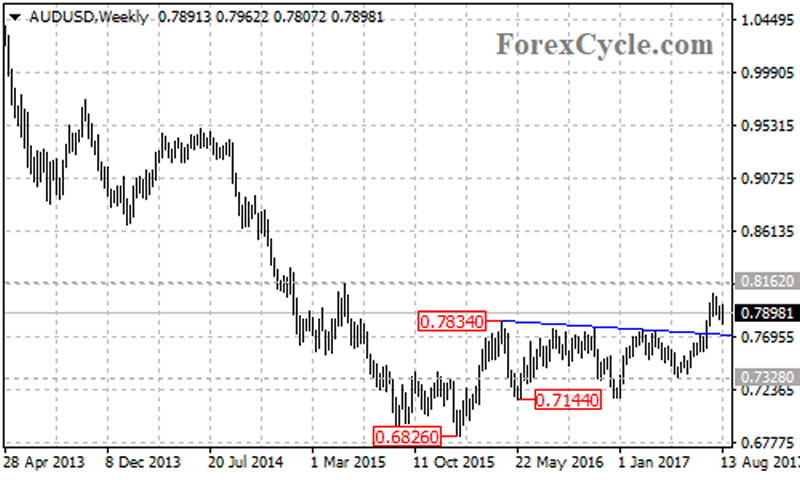
There is a resistance-turned-support trend line with support at around 0.7700 on the weekly chart. If the trend line support gives way, the fall would extend towards 0.7328.

Technical levels

Support levels: 0.7807 (the August 15 low), 0.7700 (the resistance-turned-support trend line), 0.7328 (the May 9 low), 0.7144 (the May 2016 low), 0.6826 (the January 2016 low).

Resistance levels: 0.7962 (the August 17 high), 0.8065 (the July 27 high), 0.8162 (the May 2015 high), 0.8450 (the 38.2% Fibonacci retracement taken from the July 2011 high of 1.1080 to the January 2016 low of 0.6826).

This article is written by Franco Shao, a senior analyst at ForexCycle.

© 2017 Copyright Franco Shao - All Rights Reserved Disclaimer: The above is a matter of opinion provided for general information purposes only and is not intended as investment advice. Information and analysis above are derived from sources and utilising methods believed to be reliable, but we cannot accept responsibility for any losses you may incur as a result of this analysis. Individuals should consult with their personal financial advisors.


© 2005-2022 http://www.MarketOracle.co.uk - The Market Oracle is a FREE Daily Financial Markets Analysis & Forecasting online publication.


Post Comment

Only logged in users are allowed to post comments. Register/ Log in