


The Next Tech Crash Could Delay Your Retirement by a Decade
Stock-Markets / Tech Stocks Aug 15, 2017 - 02:27 AM GMTBy: HAA

 The S&P 500 Information Technology Index recently surpassed its previous peak of 988.49 set in March 2000. It took a whopping 17 years to recoup the massive losses from the implosion of the dot-com bubble.
Not even the Federal Reserve chairman at the time, Alan Greenspan, could rein in the enthusiasm of the tech disciples with his oft-quoted 1998 “Irrational Exuberance” speech about market valuation. Valuations stretched to epic proportions as companies with little revenue and no chance to make a profit rushed to join the IPO party.
Even profitable, higher-quality names fell victim to the Ponzi scheme as growth expectations became unreasonable. In December 1999, well-known PaineWebber (now UBS) analyst Walter Piecyk assigned a $1,000 price target to Qualcomm based on the growth of wireless technology—after the company had already risen from $25 per share to more than $500 in the previous year.
It was a sure sign of the times.
Just three months later, the NASDAQ peaked at 5,132 and begun its long downward slog to 1,114 in 2002, changing the investment landscape and the dreams of many soon-to-be retirees in the process. It took many years for the index to reach this level again.
Odds are you were not entirely invested or perhaps even in the market when this occurred. However, working in retail brokerage at the time, I saw many millions in paper profits vanish and investors’ visions of retirement wiped out in months.
Only six years later, in 2008, it would happen again, albeit due to different culprit: the subprime housing market collapsed, and financial markets ground to halt.
One would hope that two vicious declines in less than a 10-year period taught mainstream investors the value of diversification and asset allocation—but all the signs point to the contrary.
IPOs Are Being Delayed
The first warning sign is the current number of IPOs. After rising to 275 new listings in 2014, IPO activity dropped off to just 105 last year, a sign that companies are finding it harder to attract capital at desired valuations.
2017’s eagerly anticipated IPO stocks, Snapchat (SNAP) and Blue Apron (APRN), have each lost approximately 50% of their respective market values.
Blue Apron, which tried to raise $30 million, was forced to cut its IPO price to $10 in the final stages to shore up demand. (It had initially wanted to raise $480 million and offer shares in the $15 to $17 range.) Both companies are burning through cash at staggering rates.
Additionally, many companies have delayed IPOs this year due to “unfavorable market conditions,” a.k.a. weak investor demand. The demand for new listings is generally a good indicator of market cycles and investor sentiment toward risk.
The Big Five Are Propping Up the Whole Market
Another notable development is the concentration of companies making up the NASDAQ.
The combined market caps of Apple (AAPL), Alphabet/Google (GOOGL), Microsoft (MSFT), Facebook (FB), and Amazon (AMZN) now exceed $3 trillion—that means these five companies comprise almost a quarter of the entire $12.5 trillion index containing more than 3,100 companies.
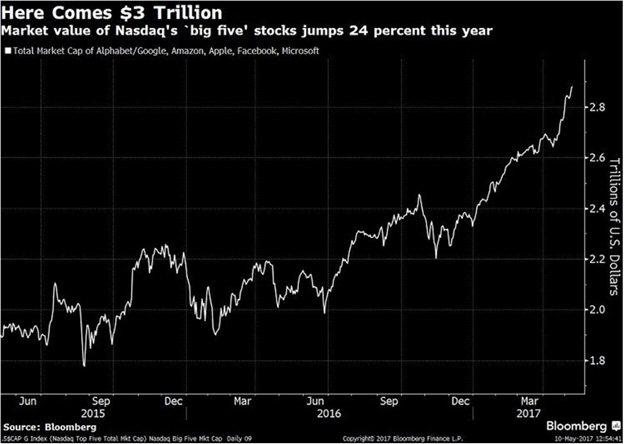
Source: Bloomberg
If these five companies were a separate index, it would be larger than the total value of stocks in any single equity market worldwide, except the five largest: the US, China, Japan, Hong Kong, and the UK.
The market value of the “Big Five” has shot up 30% so far in 2017, with Apple rising almost 40% and Amazon 25% to more than $1,000 per share.
Due to its impressive ascent this year, Apple is well on its way to becoming the first company to be valued at $1 trillion—a truly impressive and well-deserved feat, given the domination of the iPhone over the past decade.
However, 75% of sell-side analysts still rate the company a “buy” in anticipation of strong iPhone demand when the 8th version is released later this year.
Reminiscent of the $1,000 Qualcomm price target in 1999, TheStreet.com just predicted Apple’s valuation to reach $2 trillion within 10 years. It based their forecast on the company’s huge cash position and ability to make acquisitions—never mind that it’s still $170 billion away from even the $1 trillion mark.
The ETF and Index Fund Craze
A key driver of market concentration and a potential source of risk is the proliferation of low-cost ETFs and index funds, or so-called passive investments.
Retail investors can now buy ETFs tracking specific sectors and industries at virtually no cost. The net expense ratio for Vanguard’s Information Technology Index Fund (VITAX) is 10 basis points: $50 per year on a $50,000 investment. Its top holdings are Apple, Microsoft, Google, and Facebook.
According to a Bank of America Merrill Lynch study, since 2007, $1.3 trillion has flowed out of actively managed bond and stock funds and $3.1 trillion into passive bond and stock funds. Last year alone, US investors pulled $340 billion from active investment managers, mostly from mutual funds, and allocated $504 billion to passive alternatives.
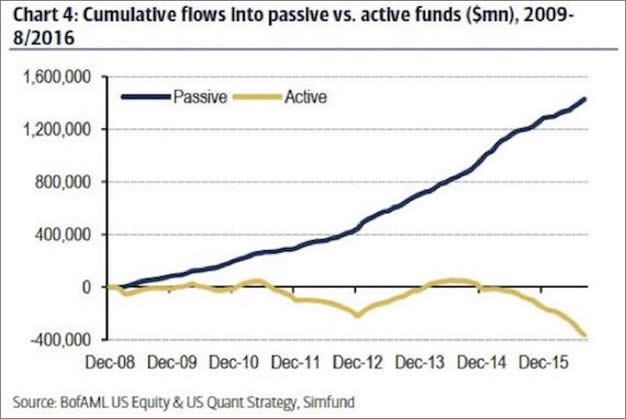
Source: ValueWalk
Because they’re so popular and easily accessible, passive investment options have encouraged scores of new investors to jump into the market, often with little to no due diligence. In addition, many brokerages have lowered their fees for buying individual stocks. Companies like Robinhood Financial even offer free trading for most listed US equities and ETFs.
This concentration will act as a double-edged sword when (not if) the market undergoes a correction. As fast as these companies and funds gained value over the past few years, they will decline even faster.
As the old saying goes, “Stocks often take the escalator on the way up, but the elevator on the way down.”
The current bull market is the second longest in history—and the longer it continues, the higher expectations will become.
Last quarter, Facebook’s revenues grew at a staggering 45% to $9.3 billion, but down from 60% growth a year earlier. When companies begin struggling to meet analyst expectations, or run short of non-GAAP tricks, such as using stock-based compensation to beat earnings numbers, they will drop precipitously.
A Bad Environment for Stocks and Funds, But a Good One for Gold
As investors are growing more skeptical about the market’s ability to sustain or exceed current valuations, it’s no coincidence that gold was up 9% in 2016 and is up 10% year to date.
Additionally, in their failed attempts to overhaul healthcare, restructure tax policy, and launch infrastructure projects, the Trump administration is starting to look more like an episode of Survivor than a team leading the world’s largest economy.

Source: New York Post
Furthermore, mounting tensions with North Korea and the Fed’s upcoming foray into reducing its massive balance sheet have investors on high alert.
Any of these factors, on top of a possible government shutdown at the end of September when the debt ceiling will likely be raised again, could send gold soaring well into the $1,300 range.
Now is the time to evaluate your portfolio and consider adding or increasing exposure to an asset that’s not correlated to most traditional stock and ETF investments.
Gold is the cheapest it’s been relative to the S&P 500 since 2005. Despite the yellow metal’s poor performance from 2012 to 2015, it has matched the performance of the S&P 500 ETF (SPY) since 2005.
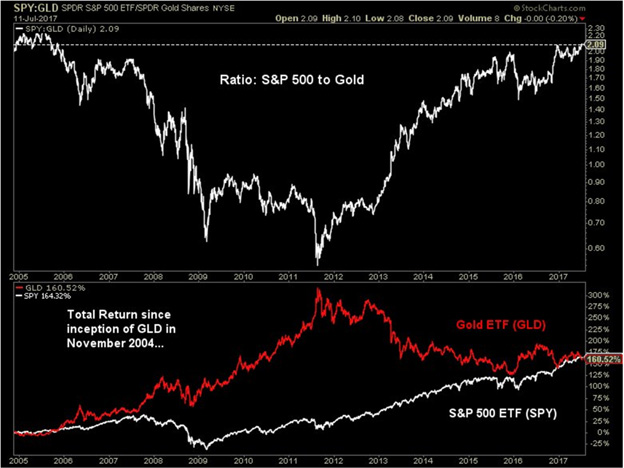
Source: Bloomberg
How would a 50% decline in the US stock market over the next two years affect your portfolio? Could you hold for a decade while it recovers, or would it ruin your retirement plans?
Gold, as a form of financial insurance, is still attractively priced, despite rising 20% since December 2015. Allocating a percentage of your portfolio to precious metals can mitigate losses during a bear market and preserve your purchasing power if the US dollar depreciates.
Get a Free Ebook on Precious Metals Investing
Right now is still a good time to add some physical gold to your portfolio. But before you buy, make sure to do your homework first.
The informative ebook, Investing in Precious Metals 101, tells you which type of gold to buy and which to stay away from… how to avoid common mistakes inexperienced investors make… the best storage options… why you should insist on allocated gold accounts… and more. Click here to get your free copy now.
© 2017 Copyright Hard Assets Alliance - All Rights Reserved Disclaimer: The above is a matter of opinion provided for general information purposes only and is not intended as investment advice. Information and analysis above are derived from sources and utilising methods believed to be reliable,
© 2005-2022 http://www.MarketOracle.co.uk - The Market Oracle is a FREE Daily Financial Markets Analysis & Forecasting online publication.