


USD/CAD - Can We Trust This Breakout?
Currencies / Forex Trading Aug 09, 2017 - 09:28 AM GMTBy: Nadia_Simmons

 Yesterday, the U.S. dollar rose against its Canadian counterpart, which pushed USD/CAD above the upper border of the declining wedge, but can we trust this breakout?
EUR/USD
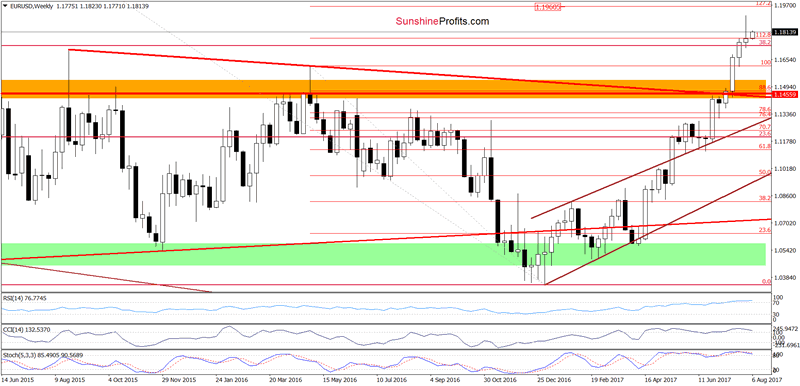
From today’s point of view, we see that the overall situation hasn’t changed much as EUR/USD is still trading around yesterday’s levels.
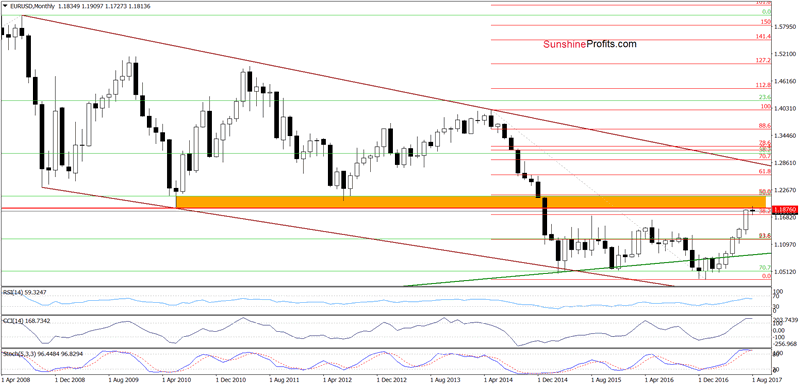
(…) Although monthly and weekly indicators are overbought, currency bulls pushed EUR/USD higher in the previous week, which resulted in a breakout above the 38.2% Fibonacci retracement based on the entire May 2014-January 2017 downward move (the retracement is more visible on the long-term chart) and the 112.8% Fibonacci extension (based on the May 2016- January 2017 downward move).
What does it mean for the exchange rate? In our opinion, such price action suggests that as long as there are no sell signals generated by the indicators, another attempt to move higher can’t be ruled out. Therefore, if the pair moves higher from current levels, the initial upside target will be around 1.1960, where the 127.2% Fibonacci extension is.
Very short-term outlook: mixed
Short-term outlook: mixed
MT outlook: mixed
LT outlook: mixed
USD/CAD
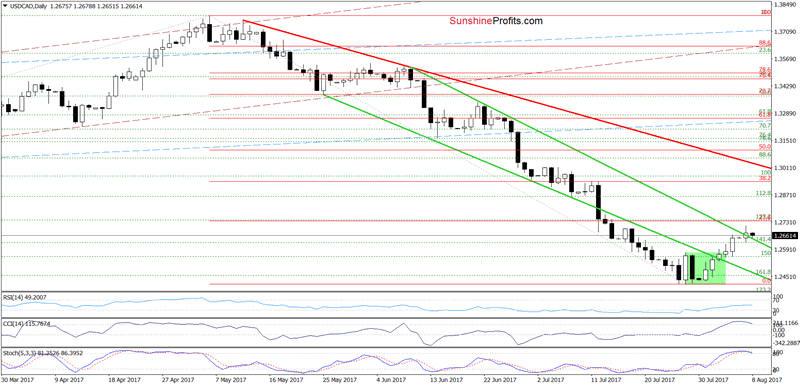
The first thing that catches the eye on the daily chart is a breakout above the upper border of the green declining trend channel. Although this is a positive development, the breakout is unconfirmed. Additionally, not far from current levels is also the 23.6% Fibonacci retracement based on the entire May-July downward move, which together with the position of the daily indicators (there are very close to generating sell signals) could encourage currency bulls to act – especially when we factor in the blue resistance zone created by the June 2016 lows (marked on the weekly chart below).
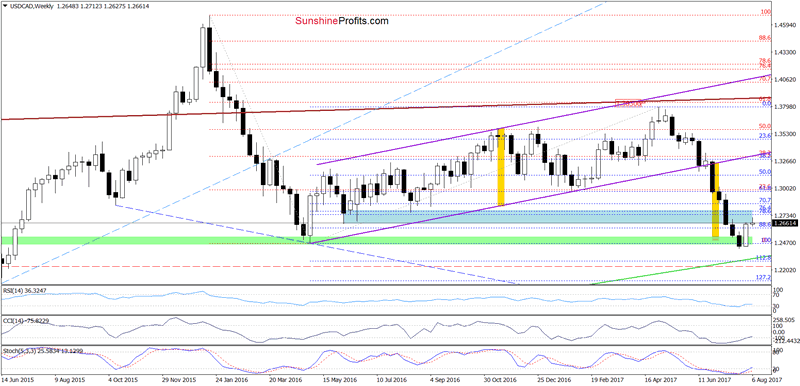
If this is the case and USD/CAD reverses and decline, we will likely see a test of the green support zone (seen on the above chart) and the lower border of the green declining wedge in the following days.
Very short-term outlook: mixed
Short-term outlook: mixed with bearish bias
MT outlook: mixed
LT outlook: mixed
USD/CHF
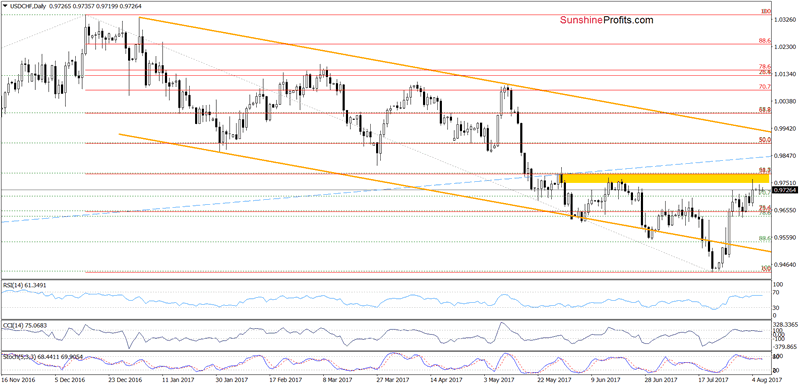
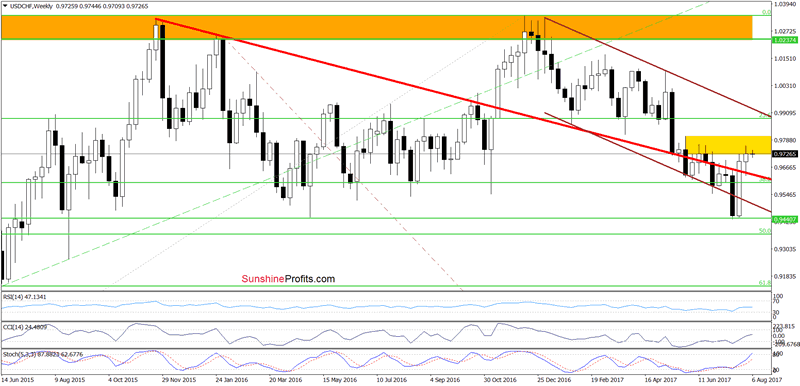
Looking at the charts, we see that invalidation of the breakdown under the lower border of the orange declining trend channel encouraged currency bulls to act, which resulted in a climb to the yellow resistance zone. After Friday’s upswing the pair started consolidation, which suggests that one more upswing and a test of the 38.2% Fibonacci retracement can’t be ruled out. Nevertheless, the sell signals generated by the daily indicators indicate that the space for increases may be limited and reversal in the coming days is likely. If this is the case and the exchange rate moves lower from current levels, the first downside target will be around 0.9630, where the last week’s low is.
Very short-term outlook: mixed with bullish bias
Short-term outlook: mixed with bearish bias
MT outlook: mixed
LT outlook: mixed
Thank you.
Nadia Simmons
Forex & Oil Trading Strategist
Przemyslaw Radomski
Founder, Editor-in-chief
Sunshine Profits: Gold & Silver, Forex, Bitcoin, Crude Oil & Stocks
Stay updated: sign up for our free mailing list today
* * * * *
Disclaimer
All essays, research and information found above represent analyses and opinions of Nadia Simmons and Sunshine Profits' associates only. As such, it may prove wrong and be a subject to change without notice. Opinions and analyses were based on data available to authors of respective essays at the time of writing. Although the information provided above is based on careful research and sources that are believed to be accurate, Nadia Simmons and his associates do not guarantee the accuracy or thoroughness of the data or information reported. The opinions published above are neither an offer nor a recommendation to purchase or sell any securities. Nadia Simmons is not a Registered Securities Advisor. By reading Nadia Simmons’ reports you fully agree that he will not be held responsible or liable for any decisions you make regarding any information provided in these reports. Investing, trading and speculation in any financial markets may involve high risk of loss. Nadia Simmons, Sunshine Profits' employees and affiliates as well as members of their families may have a short or long position in any securities, including those mentioned in any of the reports or essays, and may make additional purchases and/or sales of those securities without notice.
© 2005-2022 http://www.MarketOracle.co.uk - The Market Oracle is a FREE Daily Financial Markets Analysis & Forecasting online publication.