


Crude Oil Price Important Levels to Watch
Commodities / Crude Oil Aug 08, 2017 - 03:54 PM GMTBy: Nadia_Simmons

 On Friday, light crude moved higher and gained 1.12%, which resulted in a comeback above the previously-broken 200-day moving average. Is it enough to encourage oil bulls to act in the coming week?
Crude Oil’s Technical Picture
Let’s take a closer look at the charts and find out (charts courtesy of http://stockcharts.com).
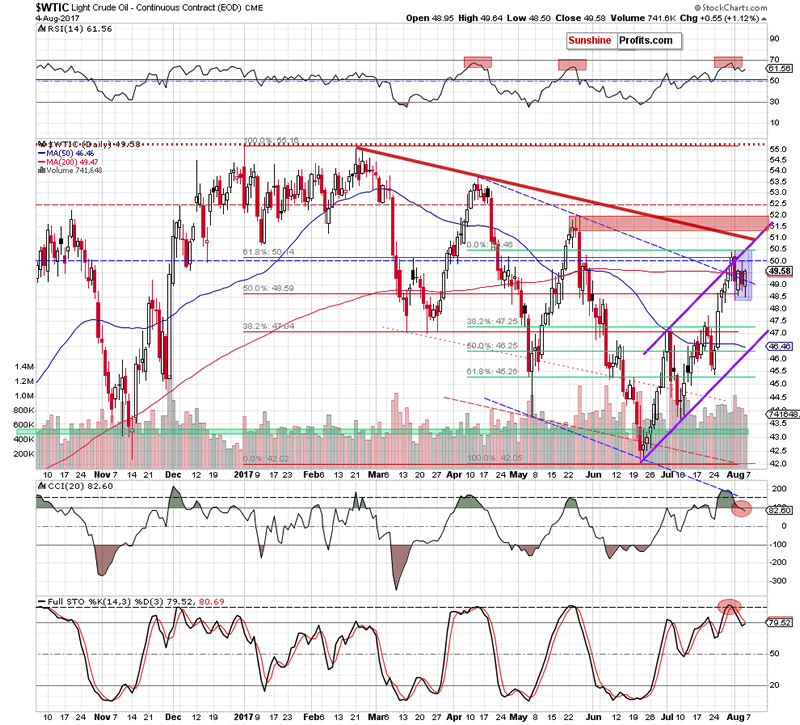
Looking at the daily chart, we see that although crude oil moved lower after Friday’s market’s open, oil bulls managed to stop declines and pushed the black gold higher. As a result, light crude came back above the previously-broken 200-day moving average, but did this increase change anything in the overall picture of the commodity?
In our opinion, it didn’t, because despite this improvement, crude oil remains in the blue consolidation under the resistance area created by the 61.8% Fibonacci retracement (based on the entire 2017 downward move), the barrier of $50 and the upper border of the purple rising trend channel.
What does it mean for black gold?
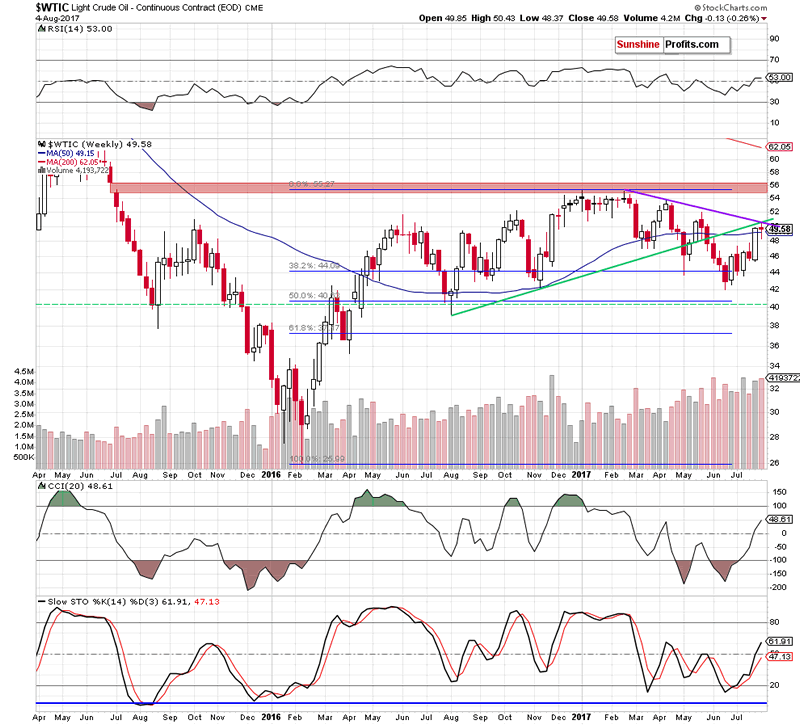
Taking into account an invalidation of the breakout above these resistance levels and its potential negative impact on the price, the sell signals generated by the daily indicators and the size of volume, which accompanied Friday’s increase (it was smaller compared to what we saw during previous downswings) we believe that oil bears have many important reasons to act, which should result in further deterioration in the coming days – especially when we factor in the medium-term picture (the commodity closed the week under the previously-broken long-term green line based on the August and November lows and the medium-term purple line based on the February and April highs).
How low could the commodity go?
If light crude moves lower from current levels, the first downside target will be the last week low, which creates the lower border of the blue consolidation (at $48.37). If it is broken, the next downside target for bears will be around $47.25, where the 38.2% Fibonacci retracement based on the entire recent upward move is. However, taking into account all negative above-mentioned factors, we think that light crude will move even lower and test the lower border of the purple rising trend channel in the coming days (currently around $46.30). Please note that this area is also reinforced by the 50% Fibonacci retracement, which could pause for a bit further declines.
Summing up, short (already profitable) positions continue to be justified from the risk/reward perspective as crude oil remains under the 61.8% Fibonacci retracement (based on the entire 2017 downward move), the barrier of $50 and the previously-broken upper border of the purple rising trend channel. Additionally, Friday’s move materialized on smaller volume than earlier declines, which together with the sell signals generated by the daily indicators suggests further deterioration in the coming days.
Very short-term outlook: mixed with bearish bias
Short-term outlook: bearish
MT outlook: mixed
LT outlook: mixed
If you enjoyed the above analysis and would like to receive free follow-ups, we encourage you to sign up for our daily newsletter – it’s free and if you don’t like it, you can unsubscribe with just 2 clicks. If you sign up today, you’ll also get 7 days of free access to our premium daily Oil Trading Alerts as well as Gold & Silver Trading Alerts. Sign up now.
Thank you.
Nadia Simmons
Forex & Oil Trading Strategist
Przemyslaw Radomski
Founder, Editor-in-chief
Sunshine Profits: Gold & Silver, Forex, Bitcoin, Crude Oil & Stocks
Stay updated: sign up for our free mailing list today
* * * * *
Disclaimer
All essays, research and information found above represent analyses and opinions of Nadia Simmons and Sunshine Profits' associates only. As such, it may prove wrong and be a subject to change without notice. Opinions and analyses were based on data available to authors of respective essays at the time of writing. Although the information provided above is based on careful research and sources that are believed to be accurate, Nadia Simmons and his associates do not guarantee the accuracy or thoroughness of the data or information reported. The opinions published above are neither an offer nor a recommendation to purchase or sell any securities. Nadia Simmons is not a Registered Securities Advisor. By reading Nadia Simmons’ reports you fully agree that he will not be held responsible or liable for any decisions you make regarding any information provided in these reports. Investing, trading and speculation in any financial markets may involve high risk of loss. Nadia Simmons, Sunshine Profits' employees and affiliates as well as members of their families may have a short or long position in any securities, including those mentioned in any of the reports or essays, and may make additional purchases and/or sales of those securities without notice.
© 2005-2022 http://www.MarketOracle.co.uk - The Market Oracle is a FREE Daily Financial Markets Analysis & Forecasting online publication.