


Canadian Dollar Bullish Trend Reversal Triggered
Currencies / Canadian $ Aug 07, 2017 - 11:52 AM GMTBy: MarketsToday

Last week the USD/CAD currency pair triggered a bullish trend reversal as it rose above the prior week’s high and closed above it on a weekly basis. That’s the first time in 13 weeks that the pair closed above the prior week’s high. At the same time the 14-period Relative Strength Index (RSI) turned up from its most oversold position since October 2007 and crossed above the 30 line. Further, a double bottom breakout was triggered on the 4-hour chart (see below). This bullish price behavior follows support hit two weeks ago at 1.2412. That’s within the area of support from early-May 2016.
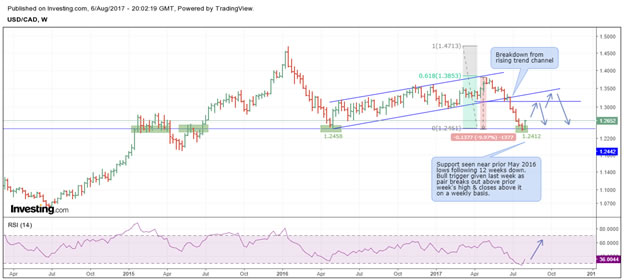
The rally follows a steady 12-week decline off the 1.3795 peak. That peak completed a 61.8 per cent retracement of the prior decline coming down from the January 2016 high, and marked the high of a 12-month ascending trend channel. A breakdown of the trend channel occurred six weeks ago with a drop below the uptrend line at the lower portion of the channel that was confirmed by a drop below the two week low at 1.3163.
Although the larger pattern is looking bearish, as we have a lower swing high from May and the breakdown of the ascending channel could be the first signal for a continuation of a developing downtrend, the odds now favor a tradeable rally off the recent low.
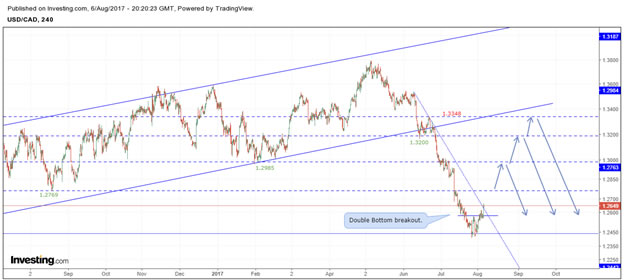
Potential targets based on previous price structure can be seen in the enclosed 4-hour chart above. The initial double bottom could hold and lead to higher prices or a larger bottoming pattern may develop. Either way, given how price historically behaves (support becomes resistance, and resistance becomes support) we should see a move back towards the uptrend line at the bottom of the channel as it’s tested as resistance.
Summary
- USD/CAD looks to have found intermediate-term support at 1.2412 two weeks ago.
- Bullish trend reversal confirmed last week on weekly close above prior week’s high. First time this has happened in 13 weeks.
- Counter-trend rally very likely to continue as it follows a steady 12-week decline.
- Good upside potential as resistance of rising trend line is quite a ways higher and key potential resistance areas are from roughly 120 pips to 700 pips away.
- Watch for how retracements develop for keys to underlying strength as the new “potential” uptrend develops.
Bruce Powers, CMT
Chief Technical Analyst
http://www.marketstoday.net/
© 2017 Copyright Bruce Powers- All Rights Reserved
Disclaimer: The above is a matter of opinion provided for general information purposes only and is not intended as investment advice. Information and analysis above are derived from sources and utilising methods believed to be reliable, but we cannot accept responsibility for any losses you may incur as a result of this analysis. Individuals should consult with their personal financial advisors.
© 2005-2022 http://www.MarketOracle.co.uk - The Market Oracle is a FREE Daily Financial Markets Analysis & Forecasting online publication.