


What Is Widespread Excessive Stock Market Optimism Indicating?
Stock-Markets / Stock Market 2017 Aug 02, 2017 - 06:36 PM GMTBy: Chris_Vermeulen

 I implement these “seasonality” charts as they have been a great framework into all of my trading/investing technical analysis. Seasonality charts are constructed from the past thirty years of historical data.
I implement them as “contrarian indicators”. The “extreme bullishness” is perceived as bearish and the “extreme bearishness” is perceived as bullish!
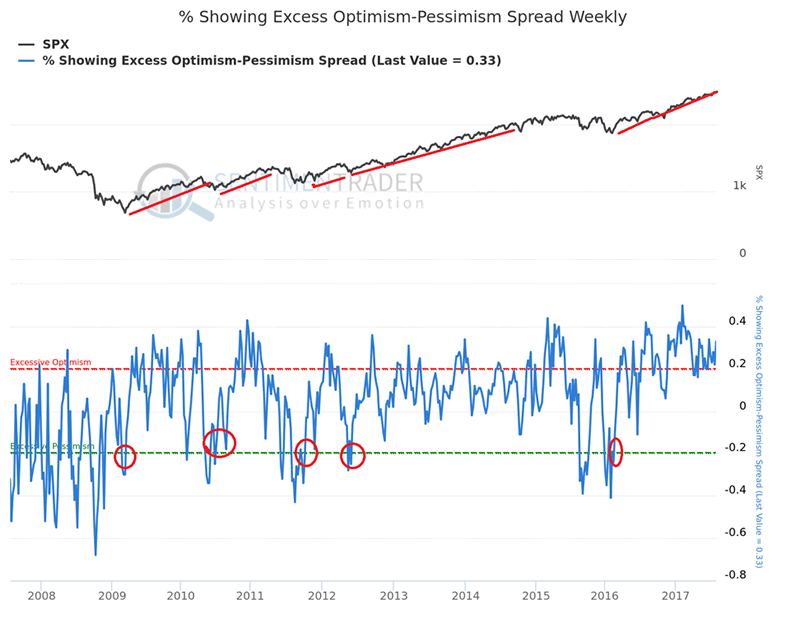
In the chart below, it displays the spread between the percentage of bulls and percentage of bears rather than just looking at bulls or bears in ‘isolation’. Many deeper internals of the BIGGER PICTURE of the overall market sentiment become more relevant!
The sentiment consensus scenario seems to be ‘lulling’ everyone to become “extremely bullish” which is a FLASHING RED WARNING SIGNAL.
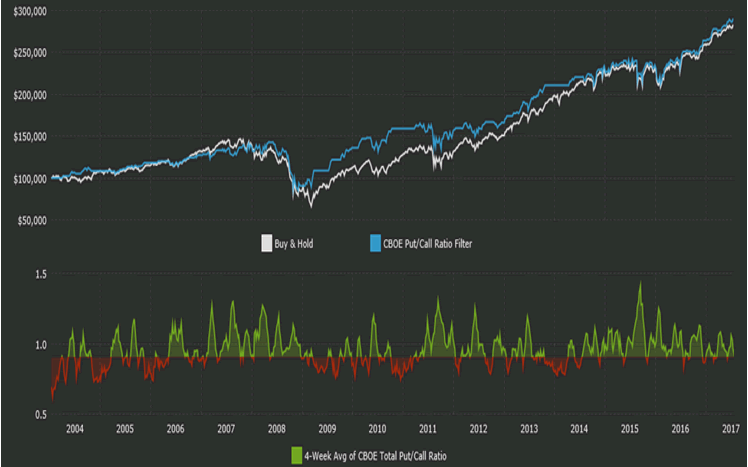
The chart below displays only the total put/call ratio to provide the most comprehensive view of options sentiment. A high put/call ratio indicates “negative sentiment”.
Latest Value(s):
- Last Reading: 0.33: JULY 28th, 2017
Extreme Values:
- Excessive Optimism: 0.2
- Excessive Pessimism: -0.2
The Rule:
If the 4-week average of the CBOE total put/call ratio is less than or equal to 0.90 (indicating optimism), you should be out of the market!
Current Reading: 1.08
Data Source: CBOE
Seasonal trends are extremely helpful in identifying typical supply/demand patterns or even new trend changes. These are self-reinforcement patterns that have emerged over time and can be taken advantage of over the years as they have proven to be highly reliable. I use ‘seasonality’ as a secondary concern for any analysis.
“Bull markets are born on pessimism, grown on skepticism, mature on optimism and die on euphoria.” -John Templeton
Is The Party Over?
It is not a coincidence that within the same window of time of the writing of this market report, Howard Marks, a quant strategist at JPMorgan, is issuing an alarm regarding the markets! (http://www.zerohedge.com/news/2017-07-27/we-may-be-very-close-turning-point-selloff-blamed-note-jpms-marko-kolanovic).
I quote him as saying “the upcoming mean-reversion will leave many in ruin, and that while there is still time to get out of the market, we may be very close to the turning point”.
Colin Cieszynski,
The Chief Market Strategist at CMC MARKETS in CANADA, https://www.cmcmarkets.com/en/news-and-analysis/featured-chart-week-of-july-31-nasdaq-100-showing-signs-of-peaking-following-bearish-key-reversal-and-round-number-failure) noted that Thursday’s (July 27th, 2017), “breakout to a new all-time high by the Nasdaq 100 and subsequent sell-off was a bearish key reversal day that may represent the peak of the recent bull market. Other bearish signs emerging include a negative RSI divergence and a failure at 6,000 a big round number”.
It seems that everyone is distracted by many topics including discussions of inflation, Fed fund rates and the lack of progress of the Trump administrations’ policies and yet no one is addressing the continuing rise of our already massive debt. The money to drive these markets higher has been borrowed. While this can continue for quite some time, it is not a solid fundamental factor of stability.
There is not a strong argument to be long stocks now, other than the fact that the trend remains up, and we have yet to see total euphoria in the market.
Sector rotation is strong and it warning that skilled traders and insiders are moving their money around to only be in the hot spots and avoiding those of weak. This is what happens during late stages of a bull market. In fact, we say this last year and the markets were on the verge of rolling over until Trump became president and that rejuvenated the markets for one last bull market surge before the end.
While analysts like the two quoted above are yelling the sky is falling, It’s not the case just yet but the end is nearing and next year could be the year to be heavily invested in cash and digital currencies.
Currently, the SPX continues to trade around our upside price target. There is little room left on the upside. When confirmed, a correction of 150 points to 200 points is highly probable on the SPX! I will immediately send out an ALERT, followed by a new market analysis update. With new positions that need to be added, to my subscribers.
Based on rough mathematical projections, it will be approximately no greater than 10%, but a minimum of at least 5%. Traders and Investors will feel like the U.S. equity markets are crashing, but they aren’t. It’s just a much-needed CORRECTION!
My general rule is that a trend is in effect until it proves that it is NOT!
American consumers have reached an almost -record level of optimism over the past 8 months. It is not the most perfect timing mechanism. The only other times that optimism for rising stock prices occurred, over such a long-time, was when it reached those levels in June 1987, December 1997, June 1999, and January 2004, which were all followed my mutli-month corrections.
Conclusion:
In short, active traders should be defensive over the next few days as we could have one more bout of selling in stocks and a spike in the vix Thrusday/Friday as we forecasted in our last article. I feel the best plays right now are short metals, short oil, long dollar.
Stay tuned for more updates, and be sure to join our stock picks newsletter, or our ETF trading newsletter for real-time trading signals.
Chris Vermeulen
www.TheGoldAndOilGuy.com – Daily Market Forecast Video & ETFs
www.ActiveTradingPartners.com – Stock & 3x ETFs
Chris Vermeulen is Founder of the popular trading site TheGoldAndOilGuy.com. There he shares his highly successful, low-risk trading method. For 7 years Chris has been a leader in teaching others to skillfully trade in gold, oil, and silver in both bull and bear markets. Subscribers to his service depend on Chris' uniquely consistent investment opportunities that carry exceptionally low risk and high return.
Disclaimer: Nothing in this report should be construed as a solicitation to buy or sell any securities mentioned. Technical Traders Ltd., its owners and the author of this report are not registered broker-dealers or financial advisors. Before investing in any securities, you should consult with your financial advisor and a registered broker-dealer. Never make an investment based solely on what you read in an online or printed report, including this report, especially if the investment involves a small, thinly-traded company that isn’t well known. Technical Traders Ltd. and the author of this report has been paid by Cardiff Energy Corp. In addition, the author owns shares of Cardiff Energy Corp. and would also benefit from volume and price appreciation of its stock. The information provided here within should not be construed as a financial analysis but rather as an advertisement. The author’s views and opinions regarding the companies featured in reports are his own views and are based on information that he has researched independently and has received, which the author assumes to be reliable. Technical Traders Ltd. and the author of this report do not guarantee the accuracy, completeness, or usefulness of any content of this report, nor its fitness for any particular purpose. Lastly, the author does not guarantee that any of the companies mentioned in the reports will perform as expected, and any comparisons made to other companies may not be valid or come into effect.
Chris Vermeulen Archive |
© 2005-2022 http://www.MarketOracle.co.uk - The Market Oracle is a FREE Daily Financial Markets Analysis & Forecasting online publication.