


DOW Jones and EURUSD Changing Fortunes Ahead....
Stock-Markets / Stock Market 2017 Aug 02, 2017 - 05:49 PM GMTBy: Enda_Glynn

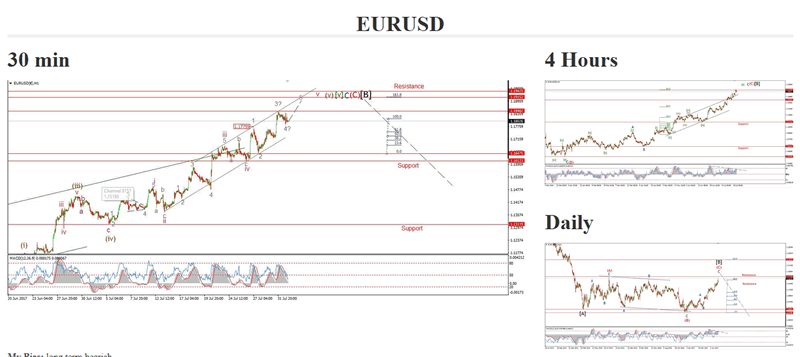
 My Bias: long term bearish
Wave Structure: downward impulse wave
Long term wave count: lower in wave (3) red
Important risk events: EUR: Spanish Unemployment Change. USD: ADP Non-Farm Employment Change, Crude Oil Inventories.
Good day to one and all!
The EURUSD party is coming to an end at seven degrees of trend right now.
I have been asked why this rally has persisted much further than I expected.
The answer lies in the high number of degrees of trend in operation here.
As the structure has progressed, each lower degree of trend has extended.
Thereby pushing the structure higher and higher above targets.
But, the extended nature of this structure leaves it open to a quick collapse.
And that is worth keeping in mind as wave '5' grey completes this week.
Back to the action.
The price corrected today in a possible wave '4' grey,
This leaves wave '5' grey left to complete the larger structure.
the upper trend line is coming into focus now.
The target range for wave '5' grey lies between 1.1915 and 1.1942.
So, for tomorrow;
Watch for another rise into the upper trendline.
I will be interested to see how the price reacts to the target range resistance.
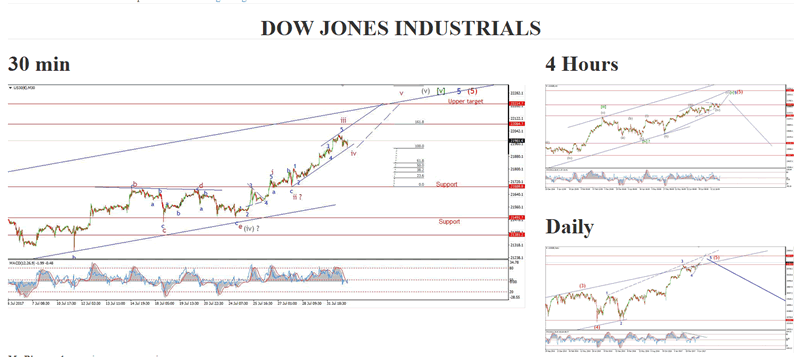
My Bias: market topping process ongoing
Wave Structure: Impulsive 5 wave structure, possibly topping in an all time high.
Long term wave count: Topping in wave (5)
Important risk events: USD: ADP Non-Farm Employment Change, Crude Oil Inventories.
The US30 CFD broke 22000 today, the cash market reached a high of 21986.
And the declines this afternoon again look corrective.
I have labelled the decline as wave 'iv' pink,
Which leaves a further rise in wave 'v' to follow into the upper trendline.
A likely target for wave 'v' pink is at the upper trendline of the rising trend channel.
This could take the price up to about 22200 before completing the larger structure.
On the 4hr chart you can clearly see a bearish head and shoulders pattern which is now half way to completion.
this is a time tested indication of a topping market,
So I will monitor the progression of that pattern from this point on.
The 4hr RSI has turned down from an extreme level in an indication of a topping momentum.
yesterdays high was 82.88.
A reading not seen since early march.
For the rest of the week;
Watch for wave 'iv' to complete and wave 'v' pink to begin.
If you want to stay ahead of the trend, and see the big market moves before they happen, CHECK OUT OUR BRAND NEW MEMBERSHIP LEVELS AT, BULLWAVES.ORG.
Enda Glynn
http://bullwaves.org
I am an Elliott wave trader,
I have studied and traded using Elliott wave analysis as the backbone of my approach to markets for the last 10 years.
I take a top down approach to market analysis
starting at the daily time frame all the way down to the 30 minute time frame.
© 2017 Copyright Enda Glynn - All Rights Reserved
Disclaimer: The above is a matter of opinion provided for general information purposes only and is not intended as investment advice. Information and analysis above are derived from sources and utilising methods believed to be reliable, but we cannot accept responsibility for any losses you may incur as a result of this analysis. Individuals should consult with their personal financial advisors.
© 2005-2022 http://www.MarketOracle.co.uk - The Market Oracle is a FREE Daily Financial Markets Analysis & Forecasting online publication.