


Crude Oil – Gold Link in July
Commodities / Crude Oil Aug 01, 2017 - 03:52 PM GMTBy: Nadia_Simmons

 On Friday, crude oil moved higher and hit a July peak supported by a weakening U.S. dollar and bullish Wednesday’s EIA weekly report. As a result, the black gold climbed above the 200-day moving average, but is it enough to trigger a rally above $50?
Crude Oil’s Technical Picture
Let’s take a closer look at the charts and find out (charts courtesy of http://stockcharts.com).
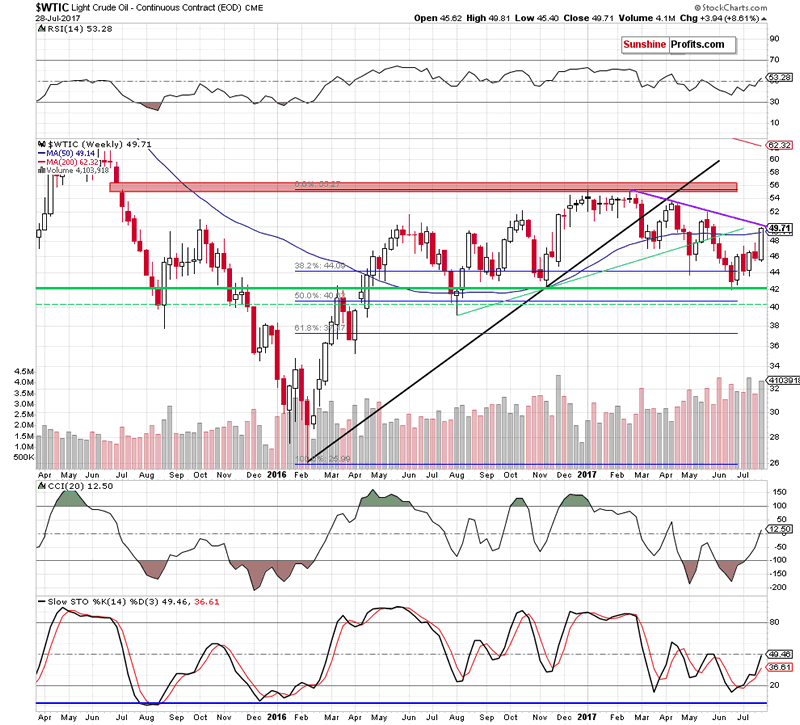
Looking at the weekly chart, we see that crude oil broke above the 50-week moving average and closed the week above it. Although this is a bullish development, we should keep in mind that thanks to the last week’s increase the commodity also approached the purple resistance line based on the previous highs, which could pause or even stop further improvement.
Will this resistance manage to push the black gold lower in the coming week? Let’s examine the daily chart and find out what can we infer from it about future moves.
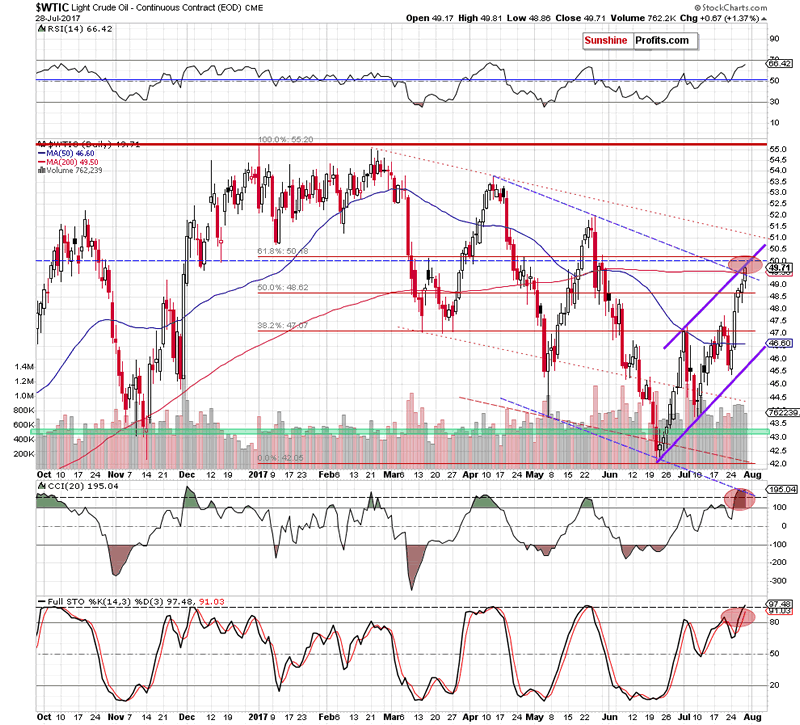
On the above chart, we see that crude oil extended gains and broke above the 200-day moving average and the upper border of the blue declining trend channel (marked with dashed line), which encouraged oil bulls to act and resulted in a move to the upper line of the purple rising trend channel.
Will we see further improvement in the coming days? As you see on the above chart, not far from current levels we can notice the barrier of $50 and the 61.8% Fibonacci retracement based on the entire 2017 downward move. This suggests that the space for gains may be limited – especially when we factor in the medium-term picture and the current position of the daily indicators. Looking at them, we see that the CCI increased to the highest level in 2017, while the Stochastic Oscillator reached levels, which triggered reversals in April and later in May.
Additionally, Friday’s upswing materialized on smaller volume than earlier increases, which may be the first sign of oil bulls’ weakness. On top of that, when we take a closer look at the oil-to-gold ratio we can notice more bearish factors on the horizon.
Crude Oil – Gold Link
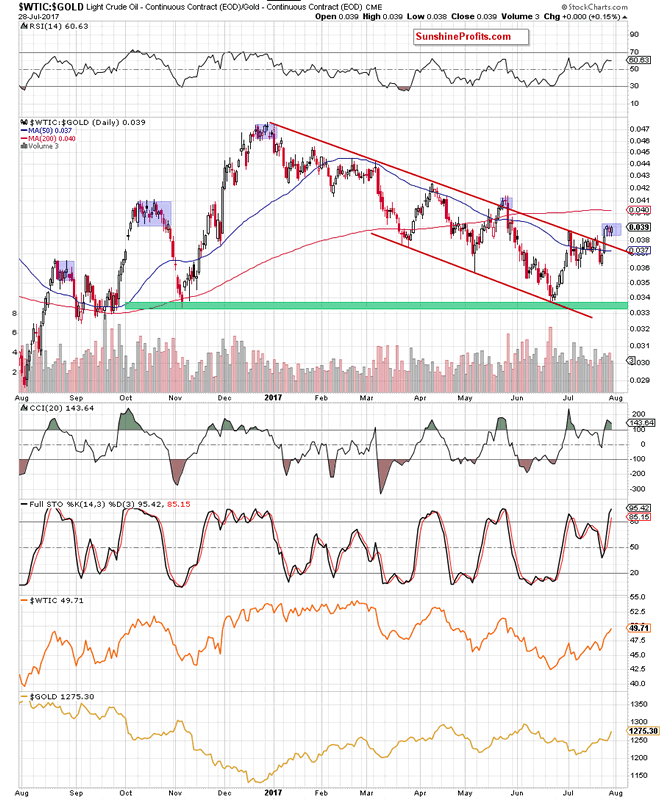
Looking at the daily chart, we see that although oil-to-gold ratio broke above the upper border of the red declining trend channel, we didn’t see a sharp move to the upside. Instead, the ratio started to consolidate, which increases the probability of reversal in the coming week.
Why? When we take a closer look at the above chart, we see that there was a similar price action in May. Back then, after the breakout above the upper line of the trend channel, the ratio started consolidation, which resulted in a reversal and declines in the following week. Additionally, looking at the daily chart, we see that there were also similar cases in 2016 and they all preceded smaller or bigger declines.
Nevertheless, taking into account the fact that there are no sell signals at the moment of writing these words, one more short-lived upswing can’t be ruled out (similarly to what we saw in the past).
How high could the ratio go? Let’s zoom out our picture and focus on the medium-term chart.
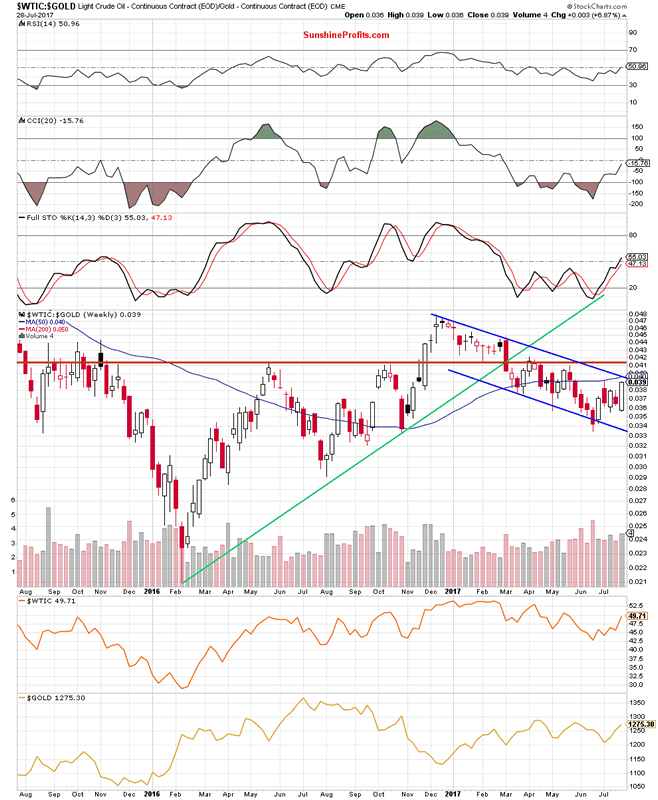
From the weekly perspective, we see that even if the ratio moves higher one again, very close to the current levels we can notice the upper border of the blue declining trend channel, the 50-week moving average and the July peak, which together could stop bulls and trigger a reversal and declines in the coming week.
How such price action could affect the price of crude oil? Taking into account the fact that positive correlation between the ratio and the commodity is still in cards, we believe that declines in the ratio will likely translate into lower prices of crude oil in the coming week(s).
Summing up, crude oil extended gains and climbed to the upper border of the purple rising trend channel, which suggests that even if light crude moves higher from here the space for gains is limited as the 61.8% Fibonacci retracement and the medium-term declining resistance line based on the previous high (marked on the weekly chart) are quite close to current levels. The pro bearish scenario is also reinforced by the current situation in the oil-to-gold ratio, which started consolidation under the upper border of the medium-term declining trend channel.
Very short-term outlook: mixed with bearish bias
Short-term outlook: bearish
MT outlook: mixed
LT outlook: mixed
If you enjoyed the above analysis and would like to receive free follow-ups, we encourage you to sign up for our daily newsletter – it’s free and if you don’t like it, you can unsubscribe with just 2 clicks. If you sign up today, you’ll also get 7 days of free access to our premium daily Oil Trading Alerts as well as Gold & Silver Trading Alerts. Sign up now.
Nadia Simmons
Forex & Oil Trading Strategist
Przemyslaw Radomski
Founder, Editor-in-chief
Sunshine Profits: Gold & Silver, Forex, Bitcoin, Crude Oil & Stocks
Stay updated: sign up for our free mailing list today
* * * * *
Disclaimer
All essays, research and information found above represent analyses and opinions of Nadia Simmons and Sunshine Profits' associates only. As such, it may prove wrong and be a subject to change without notice. Opinions and analyses were based on data available to authors of respective essays at the time of writing. Although the information provided above is based on careful research and sources that are believed to be accurate, Nadia Simmons and his associates do not guarantee the accuracy or thoroughness of the data or information reported. The opinions published above are neither an offer nor a recommendation to purchase or sell any securities. Nadia Simmons is not a Registered Securities Advisor. By reading Nadia Simmons’ reports you fully agree that he will not be held responsible or liable for any decisions you make regarding any information provided in these reports. Investing, trading and speculation in any financial markets may involve high risk of loss. Nadia Simmons, Sunshine Profits' employees and affiliates as well as members of their families may have a short or long position in any securities, including those mentioned in any of the reports or essays, and may make additional purchases and/or sales of those securities without notice.
© 2005-2022 http://www.MarketOracle.co.uk - The Market Oracle is a FREE Daily Financial Markets Analysis & Forecasting online publication.