Why the Stock Market Must Fall Hard!
Stock-Markets / Stock Market 2017 Jul 31, 2017 - 02:03 PM GMTBy: Brad_Gudgeon
 I have been warning for over a week now about a coming waterfall decline. The wave counts and cycles are at the point where I believe it is a virtual impossibility for the market not to implode Monday for the biggest one day loss of the year.
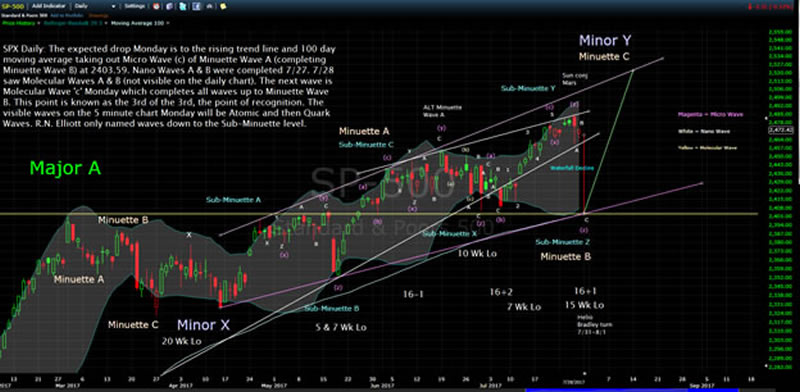
This next chart shows the daily e-wave count:

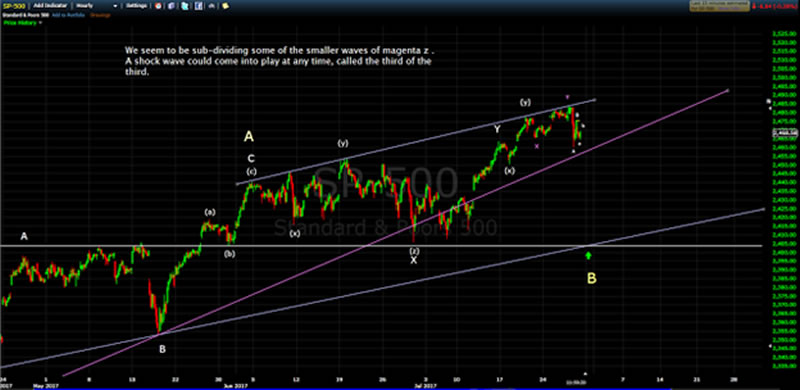
Now when we view the hourly chart (below), we see that we are down to the wire, the 3rd of the 3rd so to speak. Notice also the rising wedge pattern (above) with earlier false break.

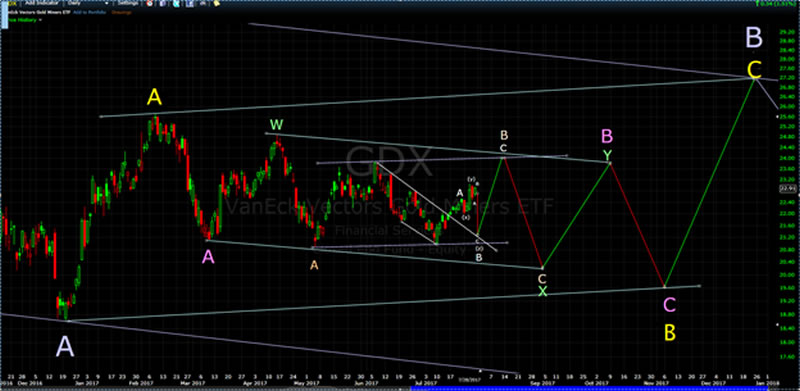
Next we view the daily chart of the GDX and future expectations (change dates 7/31, 8/14, 9/1, 10/9, 11/6, 12/22).

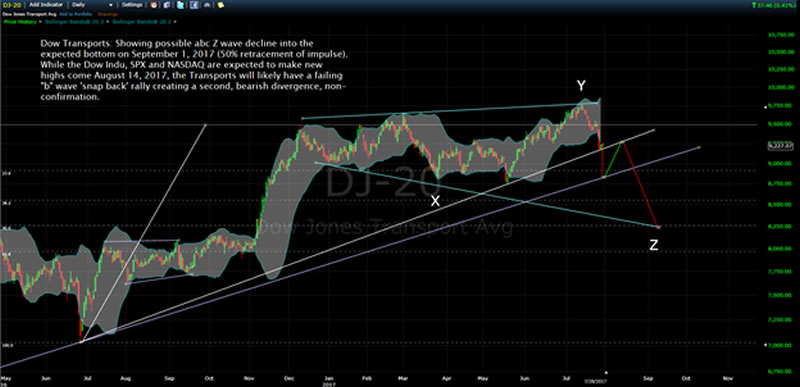
Next is a daily chart of the Dow Transports, which are breaking down badly and unlikely to recover with the expected new highs on the Indu, SPX and NDX August 14.

Brad Gudgeon
Editor of The BluStar Market Timer
The BluStar Market Timer was rated #1 in the world by Timer Trac in 2014, competing with over 1600 market timers. This occurred despite what the author considered a very difficult year for him. Brad Gudgeon, editor and author of the BluStar Market Timer, is a market veteran of over 30 years. The website is www.blustarmarkettimer.info To view the details more clearly, you may visit our free chart look atwww.blustarmarkettimer.com
Copyright 2017, BluStar Market Timer. All rights reserved.
Disclaimer: The above information is not intended as investment advice. Market timers can and do make mistakes. The above analysis is believed to be reliable, but we cannot be responsible for losses should they occur as a result of using this information. This article is intended for educational purposes only. Past performance is never a guarantee of future performance.
Brad Gudgeon Archive |
© 2005-2022 http://www.MarketOracle.co.uk - The Market Oracle is a FREE Daily Financial Markets Analysis & Forecasting online publication.


