


Stock Market SPX Uptrending Again After Minuscule Correction
Stock-Markets / Stock Market 2017 Jul 30, 2017 - 02:02 PM GMTBy: Tony_Caldaro

 The week started at SPX 2473. With nothing more than a pullback to SPX 2466 on Monday, the market worked its way to a new all-time high at 2484 on Thursday. After opening at the high the market started to pullback, then sold off to SPX 2460 in the afternoon. After that the market rebounded to end the week at SPX 2372. For the week the SPX/DOW were mixed, and the NDX/NAZ lost 0.20%. Economic reports were mostly positive, with no rate increase at the FOMC meeting. On the downtick: existing homes sales, plus jobless claims rose. On the uptick: consumer confidence/sentiment, new home sales, durable goods, and Q2 GDP. Next week’s reports will be highlighted by the ISMs and monthly payrolls. Best to your week!
LONG TERM: uptrend
After a bull market has progressed for a while, whenever there is a large pullback or a correction, many come out calling the previous high the top. It seems to occur so consistently during bull markets it is nearly predictable. When traders cannot find reasons to satisfy themselves that the market is going higher, the end is always near. What is even more odd, is that you do not find this, in reverse, during bear markets. On every major rally hardly anyone suggests the previous low was the bottom. In fact, even after the bear market low occurs most continue to think it will sell off to new lows yet again. One can only conclude the general tendency for traders is negativity. Even though bull markets are underway 85% of the time.
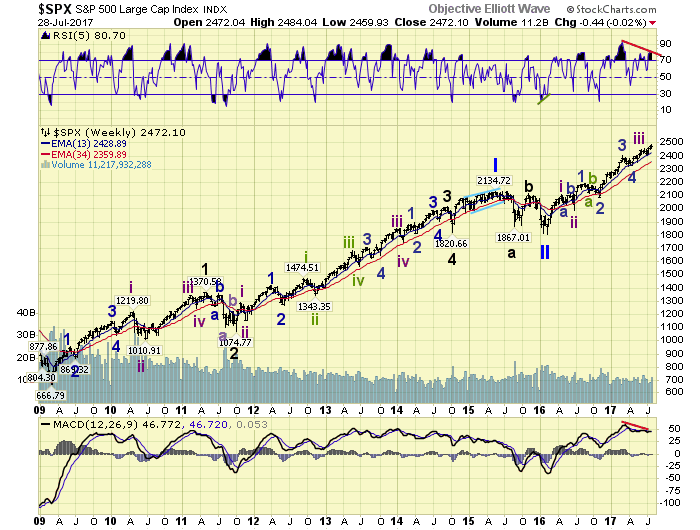
The long term count remains unchanged. A new bull market started in February 2016 at SPX 1810. Since then the market has risen 37% to all-time new highs. The wave pattern suggests the advance has unfolded in three waves thus far, with a subdividing third wave. Int. waves i and ii in the spring of 2016, then a subdividing Int. iii. Minor waves 1 and 2 ended in the fall of 2016, and Minor waves 3 and 4 ended in the spring of 2017. Recently Minor 5 may have ended at SPX 2454 in June, to end Int. iii, and an irregular Int. iv correction has been underway since then. Or, Minor 5 may subdivide itself into five Minute waves. Since the SPX has not exceeded the 2479 pivot range (2472-2486) that debate continues.
MEDIUM TERM: uptrend
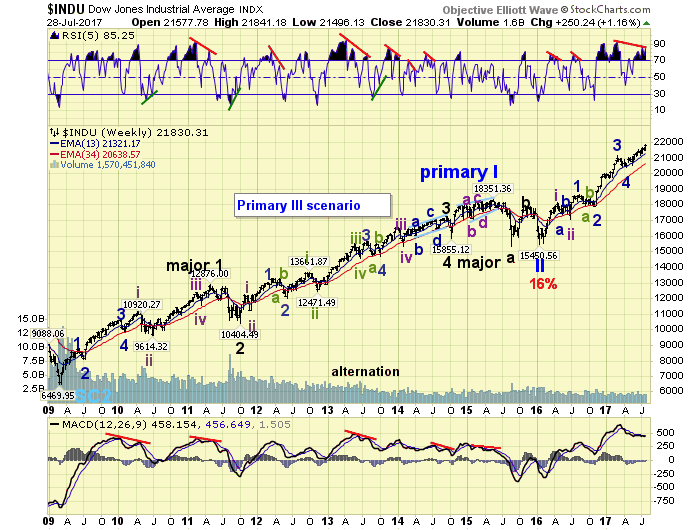
After the SPX/NDX/NAZ topped in June, then confirmed downtrends the most obvious count was that Int. iii had completed and an Int. iv correction was underway. The DOW, however, never confirmed an uptrend top in June or even the downtrend. It just kept working its way higher despite the reversals in the other indices. If you look at the DOW it still appears to be in Minor 5 as it continues to make new highs. If one looks at the NYSE chart it displays a very similar pattern: a 5th wave of a subdividing 3rd wave is underway. Since it takes five completed waves to end a bull market neither chart suggests that this bull market has topped.
With the DOW continuing to make new highs, with negative RSI/MACD divergences building across most timeframes. We can easily assume that the DOW in the process of completing Int. iii. Then when it enters a correction, the SPX/NDX/NAZ will head lower as well and complete their Int. iv waves too. This activity would then realign all four indices as they finished the 4th and enter the 5th wave of this bull market. Until this occurs there is the possibility that the DOW will continue to extend, and the SPX will break through the OEW 2479 pivot range, leading to a subdividing Minor wave 5. Either way it is quite clear this bull market has not topped yet.
SHORT TERM
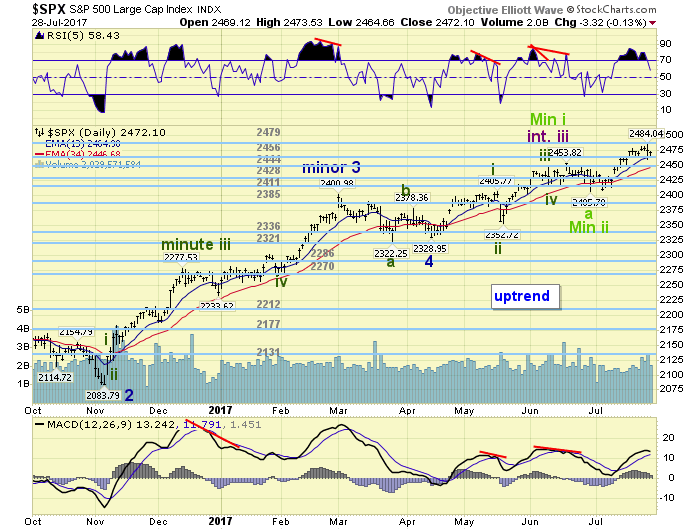
Tracking this uptrend from the July SPX 2408 low has been somewhat tedious. Volatility is so low that the entire rise to SPX 2484 has hardly produced any quantified short term waves. It just looks like a steady grind higher for nearly the entire month. Our very short-term count displays five waves: 2432-2413-2478-2465-2484, then this week’s decline to 2460. This suggests this uptrend is impulsive and not a B wave after all.
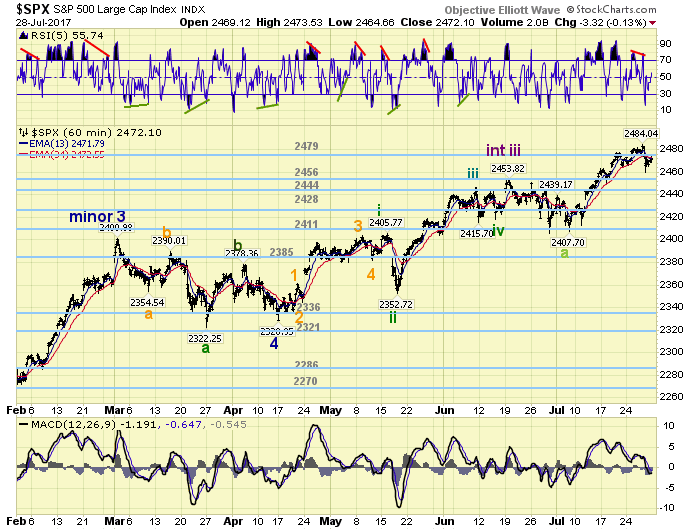
Our simpler short-term count displays just three waves: 2432-2413-2484, then the decline to 2460. Suggesting the uptrend is a corrective B wave that may have completed at the high. A rally, however, to SPX 2484+ would suggest it is an impulsive fives waves. Plus, a rally above SPX 2486 would eliminate the B wave scenario too. It appears to be a good spot for bearish traders, with an identifiable stop, while investors await the outcome. Short term support remains at the 2456 and 2444 pivots, with resistance at the 2479 and 2525 pivots. Short term momentum ended the week around neutral. Best to your weekend!
FOREIGN MARKETS
The Asian markets were mostly higher and gained 0.3%.
European markets also gained 0.3%.
The DJ World gained 0.1%, and the NYSE gained 0.3%.
COMMODITIES
Bonds remain in a downtrend and lost 0.3%.
Crude is in an uptrend and gained 8.6%.
Gold appears to be in an uptrend and gained 1.1%.
The USD remains in a downtrend and lost 0.3%.
NEXT WEEK
Monday: Chicago PMI at 9:45, and pending home sales at 10am. Tuesday: consumer income/spending, the CPI, construction spending, auto sales and ISM manufacturing. Wednesday: the ADP. Thursday: jobless claims, ISM services and factory orders. Friday: monthly payrolls and the trade deficit.
CHARTS: http://stockcharts.com/public/1269446/tenpp
After about 40 years of investing in the markets one learns that the markets are constantly changing, not only in price, but in what drives the markets. In the 1960s, the Nifty Fifty were the leaders of the stock market. In the 1970s, stock selection using Technical Analysis was important, as the market stayed with a trading range for the entire decade. In the 1980s, the market finally broke out of it doldrums, as the DOW broke through 1100 in 1982, and launched the greatest bull market on record.
Sharing is an important aspect of a life. Over 100 people have joined our group, from all walks of life, covering twenty three countries across the globe. It's been the most fun I have ever had in the market. Sharing uncommon knowledge, with investors. In hope of aiding them in finding their financial independence.
Copyright © 2017 Tony Caldaro - All Rights Reserved Disclaimer: The above is a matter of opinion provided for general information purposes only and is not intended as investment advice. Information and analysis above are derived from sources and utilising methods believed to be reliable, but we cannot accept responsibility for any losses you may incur as a result of this analysis. Individuals should consult with their personal financial advisors.
Tony Caldaro Archive |
© 2005-2022 http://www.MarketOracle.co.uk - The Market Oracle is a FREE Daily Financial Markets Analysis & Forecasting online publication.