Market Reality Is Going to Bite Back Soon
Stock-Markets / Stock Market 2017 Jul 22, 2017 - 05:18 AM GMTBy: Enda_Glynn
 My Bias: short in wave (3) red.
Wave Structure: downward impulse wave
Long term wave count: lower in wave (3) red
Important risk events: EUR: Flash Manufacturing PMI, Flash Services PMI.

Good evening fellow freedom lovers!
Sit up.
Take a look around.
And remember this time in history.
We are living in a 'GOOD TIME' market,
A market where premises are not questioned,
Hypotheses are not argued,
Hard facts and home truths are no longer heeded.
And a time where the western world has its head shoved so far up its own rear end for so long,
That we cannot even recognize reality and the way of things!
More on this later!!
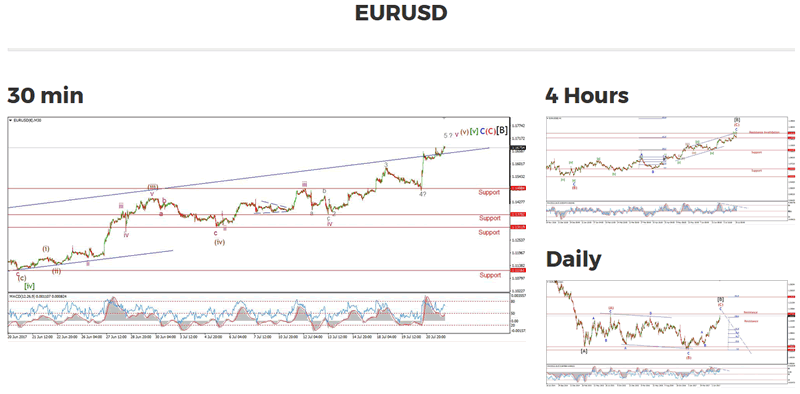
EURUSD is now stretched to breaking point.
I have run out of labels to account for this rally!
If you look at the top right of the chart,
I have shown the price now closing out at seven degrees of trend!
It is not often that we will witness this type of turning point.
The daily, 4hr and the 30 minute charts all show a bearish diverging momentum situation.
EURUSD is at a turning point to remember right now.
The market is displaying a worrying height of bullishness towards the EURO.
If we look at the COT data,
Non commercial traders are now the most bullish on the EURO since may 2011.
The price stood at 1.4670,
and then began a long collapse.
The same setup is on the table right now.
So, the market is about to teach us another lesson,
I don't see this price rising much more from here.
For next week,
I fully expect to see the diverging momentum situation start to bear down on the price.
The first sign to look for is the price to come back down below that upper trend line again.

My Bias: market topping process ongoing
Wave Structure: Impulsive 5 wave structure, possibly topping in an all time high.
Long term wave count: Topping in wave (5)
Important risk events: USD: Existing Home Sales.
Here is the reality, for those willing to listen.
Stocks overvalued to the tune of about 150% above long term historical valuation norms.
A fall of 60% would be required to bring the market back to a normal valuation level.
But the next stock market collapse will not stop at 60%.
Valuations will undershoot the long run norm to an equally crazy historical low point.
If you still have cash at that point, which will be harder achieve than you think.
You will be a king in a land of beggars!
But until we get to that point,
we must endure this madness for a little while more.
As expected in last nights analysis,
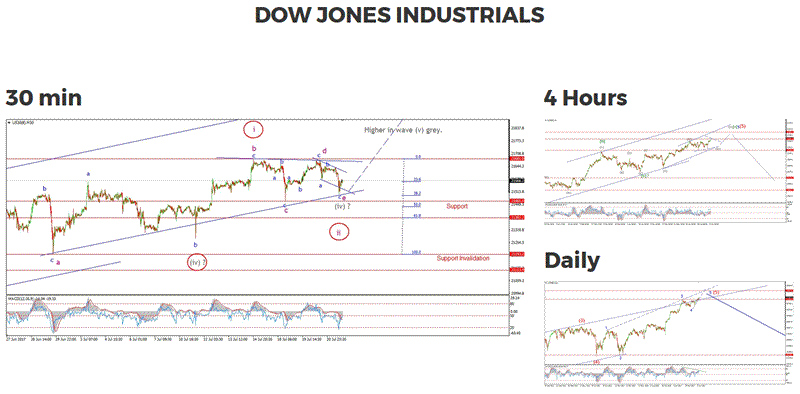
The DOW dropped about 130 points today in wave 'c' blue.
The low of the day reached 21500,
And the price has rallied back this evening to reach the price territory of the previous low at wave 'a' blue.
The probability is now rising for an extended rally in wave (v) grey to begin.
This will be the rally to end the whole bull market.
The price structure now shows a completed contracting triangle in wave (iv) grey.
Wave (i) grey was about 700 points in length,
If wave (v) grey reaches equality with with wave (i),
That projects a high in the region of 22150 to complete the larger structure in wave [v] green.
For next week;
If the price breaks above the all time high at 21681.
That will confirm wave (v) grey is underway.
Enda Glynn
http://bullwaves.org
I am an Elliott wave trader,
I have studied and traded using Elliott wave analysis as the backbone of my approach to markets for the last 10 years.
I take a top down approach to market analysis
starting at the daily time frame all the way down to the 30 minute time frame.
© 2017 Copyright Enda Glynn - All Rights Reserved
Disclaimer: The above is a matter of opinion provided for general information purposes only and is not intended as investment advice. Information and analysis above are derived from sources and utilising methods believed to be reliable, but we cannot accept responsibility for any losses you may incur as a result of this analysis. Individuals should consult with their personal financial advisors.
© 2005-2022 http://www.MarketOracle.co.uk - The Market Oracle is a FREE Daily Financial Markets Analysis & Forecasting online publication.


