


JPM Elliott Wave Bullish Structure
Companies / Company Chart Analysis Jul 20, 2017 - 02:17 PM GMT

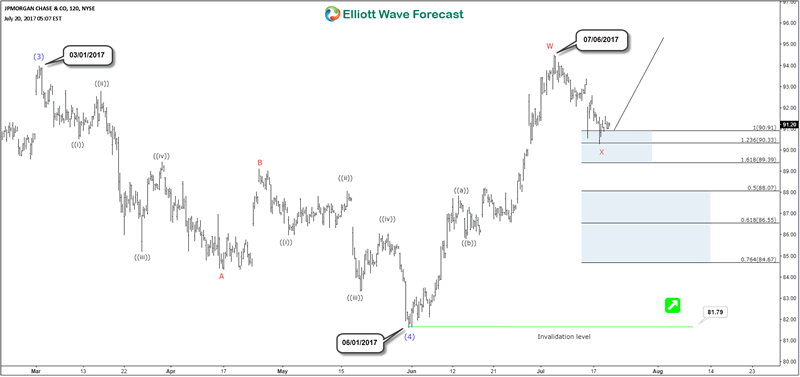
The Elliott Wave view for JPMorgan Chase (NYSE: JPM) suggests the rally from February 2016 low (52.5) to 03/01/2017 peak (93.98) have ended wave (3). The pullback from there unfolded as zigzag ABC structure which ended wave (4) at 06/01/2017 low (81.79). Up from there, the stock rallied in another zigzag structure before ending that short term cycle after reaching extreme on 07/06/2017 peak (94.51).
Therefore, JPM made new all time highs and it’s now showing 5 waves from 2016 low and still looking to reach the minimum target at $100.5. The stock can either rally from current levels as it already did 3 waves pullback and reached short term equal legs area 90.9 – 89.39, or the correction can still extend further toward the 50 – 76.4 Fibonacci retracement before finding buyers again to rally to new highs or bounce in 3 waves at least.
However if JPM fails to make new highs and the pivot at June low gives up, then the stock could be still in wave (4) doing an Irregular Flat correction which can take it toward 82-97 area before being able to resume the rally.
JPM 4H Chart 07/20/2017
The market conditions have changed over time, so instruments can now be trending higher or lower in series of 3 wave sequences rather than impulsive sequence and this can be frequently seen in the forex market. No one is perfect and we don’t claim to have 100% accuracy, but a system with high accuracy acts as a great trading tool because forecasting is a process of continuous adjustments. A waver (trader) needs to accept when an idea doesn’t work out and adjust to new data.
We will be soon launching a new plan covering Stocks & ETFs , so if you trade these instruments and interested in getting our updates then you can start by learning the basics of the Elliott Wave theory.
If you enjoyed this article, feel free to check our Technical Blog to read more posts. You can also take this opportunity and try our services 14 days for FREE to learn how to to trade forex, indices, commodities and stocks using our blue boxes and the 3, 7 or 11 swings sequence . You will get access to our current 52 instruments updated in 4 different time frames, Live Trading Room and 2 Live Analysis Session done by our Expert Analysts every day, 24-hour chat room support and much more.
By Ayoub Ben Rejeb
https://elliottwave-forecast.com
ElliottWave-Forecast has built its reputation on accurate technical analysis and a winning attitude. By successfully incorporating the Elliott Wave Theory with Market Correlation, Cycles, Proprietary Pivot System, we provide precise forecasts with up-to-date analysis for 52 instruments including Forex majors & crosses, Commodities and a number of Equity Indices from around the World. Our clients also have immediate access to our proprietary Actionable Trade Setups, Market Overview, 1 Hour, 4 Hour, Daily & Weekly Wave Counts. Weekend Webinar, Live Screen Sharing Sessions, Daily Technical Videos, Elliott Wave Setup .
Copyright © 2017 ElliottWave-Forecast - All Rights Reserved Disclaimer: The above is a matter of opinion provided for general information purposes only and is not intended as investment advice. Information and analysis above are derived from sources and utilising methods believed to be reliable, but we cannot accept responsibility for any losses you may incur as a result of this analysis. Individuals should consult with their personal financial advisors.
© 2005-2022 http://www.MarketOracle.co.uk - The Market Oracle is a FREE Daily Financial Markets Analysis & Forecasting online publication.