“Secular Stagnation” Is Nonsense… Here’s the Real Reason Behind the US Downturn
Economics / Stagflation Jun 28, 2017 - 06:13 PM GMTBy: John_Mauldin
 My good friend Charles Gave recently wrote an instructive article titled “Tale of Two Countries.”
In the UK and France, structural growth rates have diverged since 1981. The rate has fallen by two-thirds in France, while in the UK it has risen.
Why?
Well, to begin with, in the UK, Margaret Thatcher was elected prime minister in 1979. She reduced the role of the bureaucracy in managing economic activity and dialed back government spending as a percentage of GDP.
Meanwhile, in France, François Mitterrand was elected president in 1981 on a platform that expressly aimed to expand the scope of government.
“The effects on growth were predictable,” says Charles.
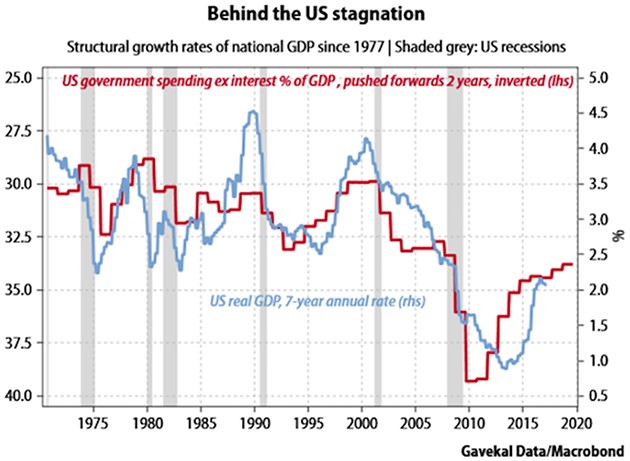
Meanwhile in the US, when government spending as a percentage of GDP shot up from 33% to 39% during the Great Recession, our growth rate fell from 2.5% to less than 1%.
And that, says Charles, is the story on US stagnation.
Now, without further ado, I’ll let Charles unpack his intriguing narrative.
So We Are In Secular Stagnation...
By Charles Gave
June 19, 2017
…really? I would advise readers to consider the chart below.
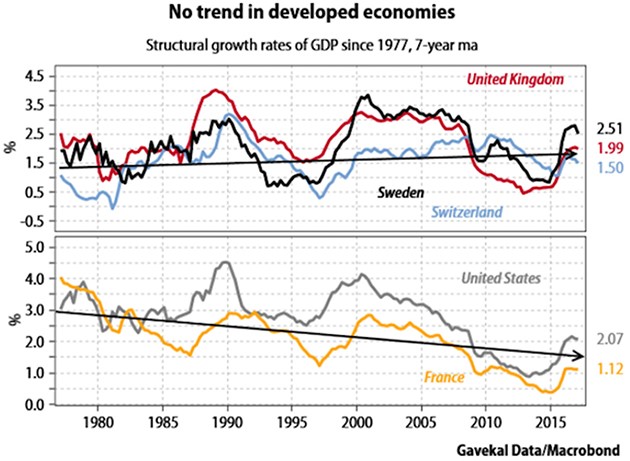
On first blush, its lower pane supports the stagnationist camp. After all, both the US and France have seen a slump in their “structural” GDP growth rate, as shown by the seven year moving average. Since 1977 this measure has fallen by a third in the US, and by two thirds in France. Yet, look at the chart’s top pane and it is clear that this growth slump has hardly been generalized. Since the late 1970s, Sweden, the UK and Switzerland have seen their growth rates rise structurally, and the same pattern can be found with Canada, Germany and Australia.
Cause and effect
So why have certain economies tumbled into relative decline, while others have not? A useful approach may be to compare France and the UK, which are similar in size, population and demographic profile. Both countries are European Union members with big banking sectors that in recent decades have had to manage profound de-industrialization.
Consider the chart below which shows a ratio of real GDP in France and the UK. No adjustment is made for currency movements as this will introduce unnecessary noise into the analysis. The obvious point is that between 1955 and 1981, France’s economy massively outperformed the UK’s. Since 1981, the reverse has been true.
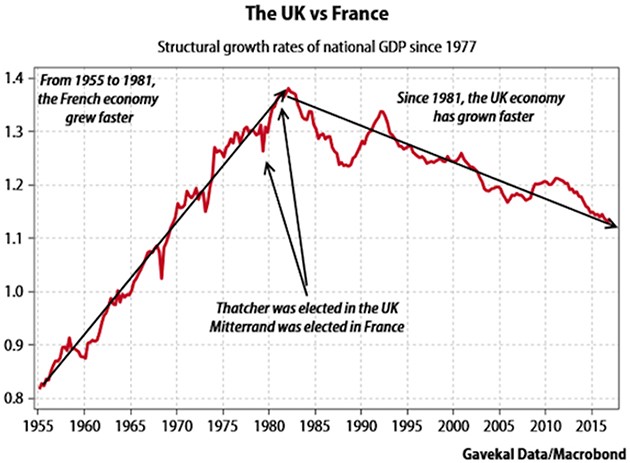
The trend change corresponded to a political shift in both countries as to the proper role of the state. Under Margaret Thatcher, the UK forged a new path by lessening the role of civil servants in managing economic activity. In France, François Mitterrand expressly aimed to expand the scope of government.
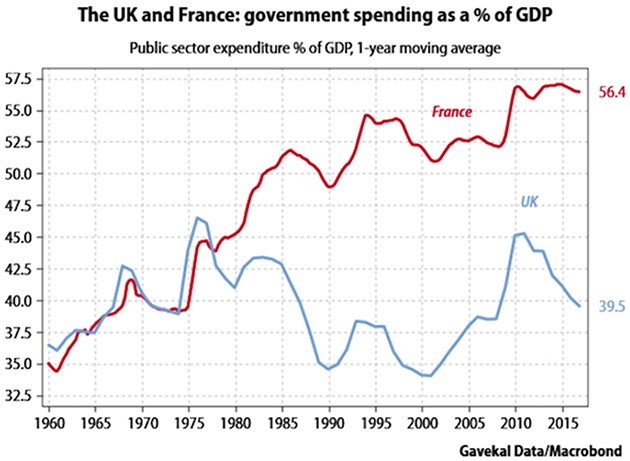
To be sure, the UK Labour Party got back into power in the late 1990s and spent the next decade running socialist policies that caused government spending as a share of output to rocket higher. Fortunately, sanity was restored after 2010 when a Conservative-led government dialed back UK public spending. In France, the picture is different as there have not been politically-inspired changes in the trend of government spending—the ratio has simply ground higher, irrespective of who was in power.
The next task is to explore potential cause-and-effect linkages between public spending and the divergence in the structural growth rates of France and the UK. As such, consider the chart below which reconciles growth and government spending in the two economies.
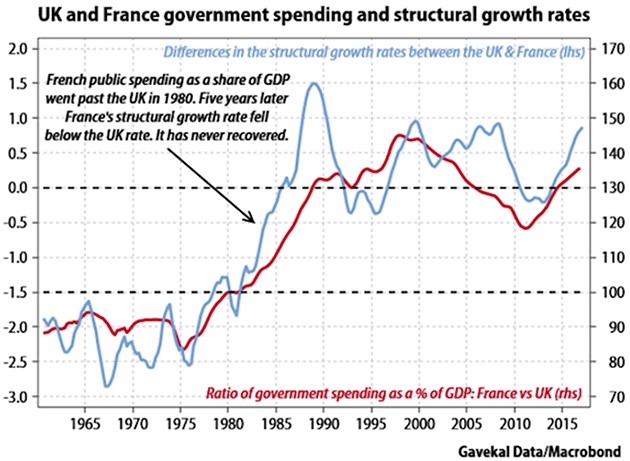
The chart above shows that in 1980 France started to spend more on government than the UK. By 1985, France’s structural growth rate slid below the UK rate and has not recovered. The logic behind this chart has been borne out in many economies: beyond a certain threshold (that varies by country) more state spending causes the structural growth rate to fall. This relationship follows, as in a government-dominated economy “destruction” of inefficient activity is all but impossible, which in turn limits the scope for fresh “creation”. This insight was explained by Joseph Schumpeter in his 1942 book Capitalism, Socialism and Democracy.
What about the US?
In the US, a similarly straight forward picture emerges, with the big increase in government spending that took place after 2009 being the main cause of the subsequent decline in the US’s structural growth rate.
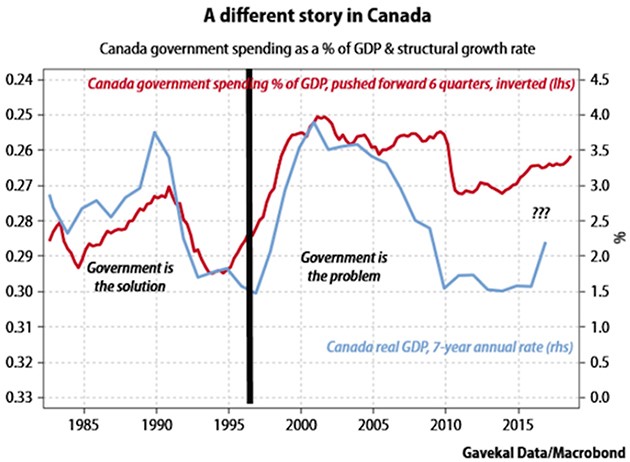
By way of contrast, consider the reverse case of Canada, which in the mid-1990s slashed government spending to good effect. In two years Canadian government spending was cut from 31% of GDP to about 25%. The ensuing 18 months saw predictable howls of protest from economists that a depression must follow. In fact, not only was a recession avoided but Canada’s structural growth rate quickly picked up and in the next two decades a record uninterrupted economic expansion was achieved.
As an aside, I would ask readers to cite one case in the post-1971 fiat money era when a big rise in government spending did not lead to a structural slowdown. Alternatively, if they could cite an episode when cuts to public spending resulted in the growth rate falling. I am always willing to learn and change my mind!
To conclude, “secular stagnation” is an idea of ivory towered economists. Schumpeter showed how bloated government and unnecessary regulation crimps activity. The perhaps unfashionable answer remains to privatize state enterprises, deregulate markets and break up too-big-too-fail banks. In simple terms, some government is good; too much government is bad.
Get Varying Expert Opinions in One Publication with John Mauldin’s Outside the Box
Every week, celebrated economic commentator John Mauldin highlights a well-researched, controversial essay from a fellow economic expert. Whether you find them inspiring, upsetting, or outrageous… they’ll all make you think Outside the Box. Get the newsletter free in your inbox every Wednesday.
John Mauldin Archive |
© 2005-2022 http://www.MarketOracle.co.uk - The Market Oracle is a FREE Daily Financial Markets Analysis & Forecasting online publication.


