


Silver SLV ETF Bull Market Remains Intact
Commodities / Gold & Silver Aug 20, 2008 - 09:23 AM GMTBy: Chris_Vermeulen

 SLV ETF Trading - Panic, Shouting & Media Hype!
It's all too easy to lose yourself and your position under emotional strain.
Let's face it, it's hard to think straight when a voice inside your head is screaming GET ME OUT OF HERE!
And don't think emotional reflexes are the preserve of amateur's only. Professional Money Managers are certainly not immune to panics, especially since they are judged on much shorter timeframes and scrutinized intensely against benchmarks and peers.
That said we find 2 trading techniques help us to sit tight with our positions:
1 – Never bet the Farm.
2 – Remain focused on the big picture at all times.
Regarding rule 1: The winner in investing is the one who stays in the game the longest. No matter what kind of slam dunk you think you've got, DON'T go betting the farm, strange things happen under the Sun! The last thing you want to do is take a loss that takes you out of the game PERMANENTLY. Size your positions accordingly.
Regarding Rule 2: The best way (we find) to remove emotions from the picture is to keep an Eagle eye on the charts. And here we find it best to start with longer dated monthly charts which give us a sense of where price action has been.
Take our current favourite – Silver or SLV the Silver Bullion ETF:
Figure 1 - SLV ETF monthly still in long-term uptrend
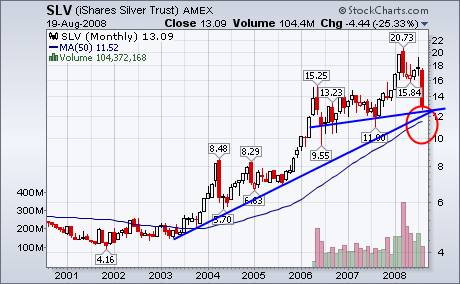
Some noteworthy items:
* SLV etf has been in a bull market since 2001 and the price has risen by 5X.
* Since 2002 the 3 rd and 4 th quarters of each year have been strong for SLV.
* The current correction is similar in magnitude to the early 2004 correction.
* Throughout all gut wrenching corrections, the price has remained above the blue uptrend line.
* The price is now at significant support in the form of the abovementioned uptrend line; horizontal support (second blue line) and 50 Month Moving Average (red circle).
Synopsis: Whilst it is impossible to say whether support will hold (we discuss the fundamentals below) we do think the current level offers an excellent entry point once we have a low risk setup in our trading model.
Let's take a closer look:
Figure 2 - SLV ETF Weekly Chart
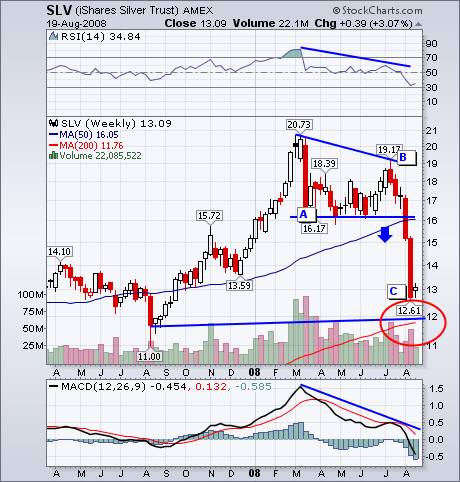
The takeaways from the above chart:
• The SLV double top in July ($19.17) was difficult to identify because it was somewhat short of the exuberant $20.73 reached in February. However the extreme divergence in the RSI (top) and MACD (bottom) was an early sign that SLV had topped out.
• Once the price dropped below support at $16 (blue line and 50-week moving average) the chart painted a technical target of around $12 (lower blue line).
• The correction has followed a classic Elliot Wave A-B-C (marked above) where the magnitude of wave C equals Wave A and once again paints a target for SLV of $12 (red circle).
• In addition to representing a technical correction target, $12 is strong support on the monthly chart (figure 1) as well as the August 2007 bottom and 200-Week Moving average.
• We would be amiss if we didn't point out that $12 has not been reached just yet.
And finally, to round off the picture lets zoom in on the daily chart for SLV:
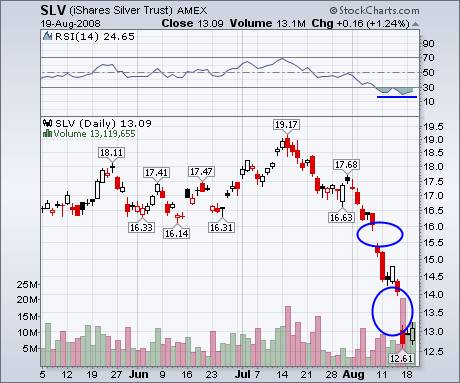
Figure 3 - SLV ETF Trading Chart, Daily
Noteworthy items here are the 2 gap down events (blue circles) and the potential double bottom in the RSI (top).
The rationale behind gap events in technical parlance is that markets HATE a vacuum and usually end up backing and filling the gaps – at least that has been our experience.
The double bottom on the RSI is a hopeful sign that the downward price action is decelerating.
Long-Term Fundamentals for SLV
The fundamentals are probably even more bullish now than before the sell-off (we know that's no consolation). Supply remains slow coming on-stream as new mines take months and years to get up to full production.
On the demand side, if you believe (as we do) that Precious Metals (Gold and Silver) are the antithesis of financial paper assets. And the institutions who are bastions of those financial assets remain seriously encumbered, with more to come, then you'd agree that the demand for SLV will remain robust.
Anecdotally, the Silver Bullion dealers we have spoken to all tell us that demand for Physical Silver (of which SLV is the ETF) has actually increased since the sell-off and Silver Rounds and Bars are hard to come by.
To conclude: Technically we are near a buy zone for SLV. Whilst we may yet go down to test $12 we are now close enough to the Buy Zone for probabilities to be skewed in our favour. WE will be looking at SLV at these prices over the next few weeks for a possible entry!
More commentary and stock picks follow for subscribers…
By Chris Vermeulen
Chris@TheGoldAndOilGuy.com
Please visit my website for more information. http://www.TheGoldAndOilGuy.com
Chris Vermeulen is Founder of the popular trading site TheGoldAndOilGuy.com. There he shares his highly successful, low-risk trading method. For 6 years Chris has been a leader in teaching others to skillfully trade in gold, oil, and silver in both bull and bear markets. Subscribers to his service depend on Chris' uniquely consistent investment opportunities that carry exceptionally low risk and high return.
This article is intended solely for information purposes. The opinions are those of the author only. Please conduct further research and consult your financial advisor before making any investment/trading decision. No responsibility can be accepted for losses that may result as a consequence of trading on the basis of this analysis.
Chris Vermeulen Archive |
© 2005-2022 http://www.MarketOracle.co.uk - The Market Oracle is a FREE Daily Financial Markets Analysis & Forecasting online publication.