


Crude Oil Sinks 20%: Why "Oversupply" Isn't the Half of It
Commodities / Crude Oil Jun 28, 2017 - 03:33 AM GMTBy: EWI

 Oil prices have defied bullish efforts to curb oversupply. Here's our take on why.
I have a friend... let's call him Larry. Let's just say, Larry is not a fan of taking risks. He likes his reflexes fast, his cars slow, and his financial markets secure for the long haul.
So, when Larry called me up at the beginning of this year to say he's boarding the highly-volatile crude oil market, I was appropriately stunned. But here's the thing. He was still being "wary Larry," meticulously weighing the risks. It just so happens they seemed to pale in comparison to the overwhelming rewards.
See, at the time, oil bulls had been served the ultimate bullish advantage on a black-gold platter; namely, the first major oil supply cut in eight years.
To recap: On January 1, the long-awaited agreement between OPEC and its major exporting partners like Russia to curtail production by 1.8 million barrels a day went into effect.
And, according to the mainstream experts, the massive effort to cut the oil glut would also light the fire beneath oil prices. Here, these news items from January 2017 capture the bullish enthusiasm for crude's upside:
- "Bullish bets on oil rose to a record in January, reflecting widespread optimism that crude prices are poised to move higher as OPEC starts cutting." (Jan. 31 Wall Street Journal)
- "Oil prices are expected to remain on the upside in 2017... supply reduction deal not to disappoint." (Jan. 21 South China Morning Post)
- "Crude oil prices have begun the year with a bang. The rally got a boost from the OPEC agreement... The strong rally beyond $50 has wiped out the threat of any sharp fall in price." (Jan. 3 Hindu Business Line)
Yet -- instead of rallying, crude oil prices did the total opposite. After a brief spike, first prices went sideways, and come February, oil prices lost their grip on an 18-month high, falling in a down-up-down series to a 10-month low on June 20.
In fact, since February, oil prices have plummeted 20% to enter official bear-market territory, enduring their worst first half-year in two decades.
It goes without saying that Larry, along with the entire throng of supply-cut-watching-oil-bulls, were caught off guard by oil's slide. Beckoned a June 21 news source:
"Bulls discount OPEC cuts...as oil set for worst H1 [econ speak for first half of the year] since 1997. The slide in oil prices seems to be unstoppable. The supply deal's effectiveness is increasingly questioned." (Reuters)
Wait. Now -- six months later and 20% lower in price -- the "supply deal's effectiveness" is questioned? What about before?
See, we believe oil's selloff was going to occur despite OPEC's historic cuts. The reason being, the oil cartel does not control the long-term oil price trend; investor psychology, which unfolds as Elliott wave patterns on oil's price chart, does.
And, right at the onset of oil's turn down, on February 22 our Energy Pro Service identified a bearish, Elliott wave structure on oil's price chart. There, Energy Pro Service chief analyst Steve Craig outlined the following long-term course and wrote:
"Repeating: The jury is out, but my working assumption is that wave (A) of triangle wave ((4)) has concluded. If so, the market should trace out a large zigzag for the wave (B) decline that retraces at least 55% of the wave (A) advance."
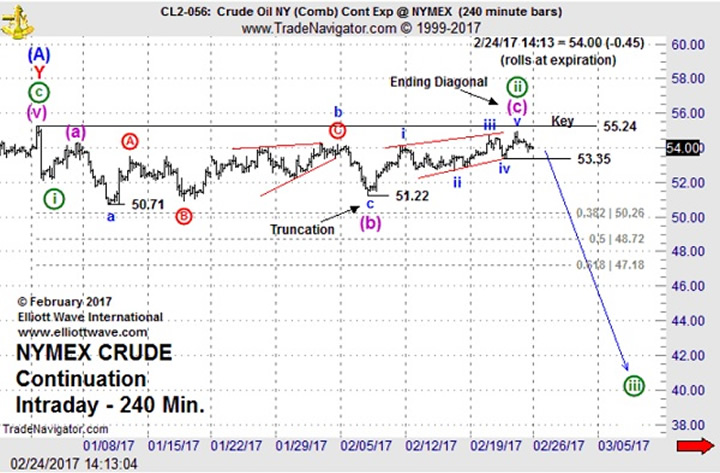
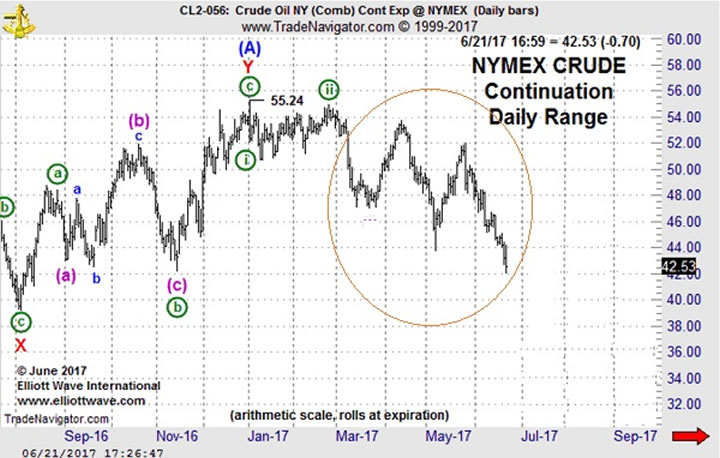
The next chart captures the complex unwinding of oil prices into bear market territory:
It's safe to say, next time wary Larry decides to participate in the oil market, he may think twice about relying 100% on fundamental, news-led analysis as his guide.
Adding Elliott wave analysis into the mix may just give him -- and you -- that objective, risk-limiting insight into crude oil's next big move all traders look for.
Get 10 Lessons on The Elliott Wave Principle
Learn how you can apply the Wave Principle to improve your trading and investing in this free 10-lesson tutorial. You'll learn:
- What the basic Elliott wave progression looks like
- Difference between impulsive and corrective waves
- How to estimate the length of waves
- How Fibonacci numbers fit into wave analysis
- Practical application tips for the method
This article was syndicated by Elliott Wave International and was originally published under the headline . EWI is the world's largest market forecasting firm. Its staff of full-time analysts led by Chartered Market Technician Robert Prechter provides 24-hour-a-day market analysis to institutional and private investors around the world.
© 2005-2022 http://www.MarketOracle.co.uk - The Market Oracle is a FREE Daily Financial Markets Analysis & Forecasting online publication.