


Gold’s Seasonality: Time to Get Positioned Ahead of Strongest Months
Commodities / Gold and Silver 2017 Jun 23, 2017 - 04:48 PM GMTBy: HAA

 Despite the recent weakness, the price of gold is still up 9% year to date and may be poised for a strong second half of 2017. This is not unusual: the yellow metal also had a strong start in 2016, only to give back some gains but ended the year in an uptrend, setting up a rally as the calendar moved to 2017.
So is there a seasonal pattern to the gold price? To answer that question, we dissected gold’s performance dating back to 1975 and identified some trends investors can use to their advantage.
March/April Are Gold’s Worst Months…Often Followed by Weakness in the Spring and Summer
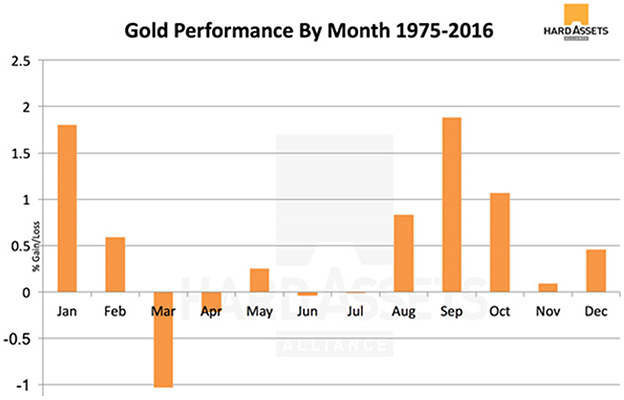
Source: LBMA
Since 1975, March has been the worst month for gold, followed by April as the second-worst. The months of June and July tend to be a quieter period as investors shift their focus prior to strong later summer and fall months.
September has been the best month for gold over the past 41 years. Coincidentally (or not), September is also the worst month for the S&P 500.
As the chart shows, three-quarters of gold’s top-performing months are in the latter half of the year—a good reason to consider buying in June or July if you want to add physical precious metals to your portfolio.
Bearing in mind the volatile nature of commodities, gold included, an experienced investor will build a position after periods of market weakness. As June comes to a close, we’re near the end of the seasonal weakness for gold—soon to enter its historical prime time from August to October.
Attempting to time the market is an exercise in futility. While it will work for a fortunate few, most investors will end up wasting time staring at charts and reading countless opinion pieces by so-called “experts” and talking heads.
To make gold’s volatility your friend, focus on buying when the market has been down for several days, or even a couple of weeks in a row. Then, perhaps more importantly, focus on enjoying your summer vacation.
The Third Quarter Is the Strongest—So Act Now
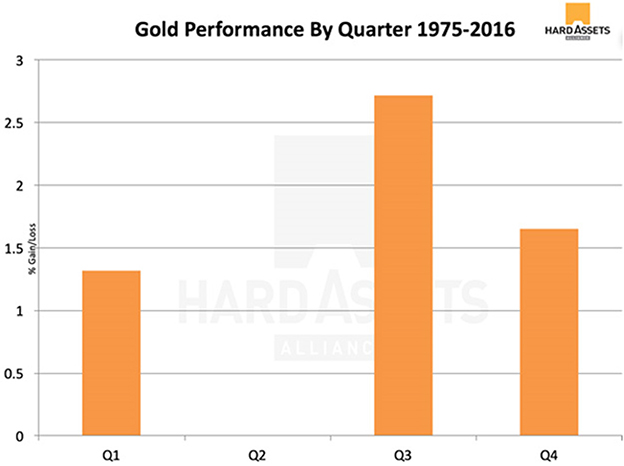
Source: LBMA
Since 1975, the second quarter of the year has been by far gold’s worst—with returns dead flat over the 41-year period—and this year has been no exception, with gold down about 1%. On the flip side, the third quarter has been the best, outperforming its closest rival, Q4, by a whopping 40%.
Given the clear seasonal patterns gold has exhibited over the past four decades, investors can use these trends to make strategic purchases when the market is the weakest.
Add Gold to Your Portfolio Now
Based on gold’s seasonal patterns, adding bullion to your portfolio sometime in the next month or two could prove a very smart move.
As stated above, gold is up 9% since the beginning of the year, rivaling the performance of the S&P 500, which makes it one of the top-performing assets.
In comparison, since making multi-year highs in March, the 10-year Treasury yield (which moves inversely to its price) is down 15%, and the S&P 500 has traded mostly sideways despite stronger-than-expected first-quarter earnings. Based on declining Treasury yields and gold’s overall strong performance, investors clearly have taken a more cautious approach the past few months.
With gold rallying close to $1,300/oz. earlier this month, many people have waited patiently for a pullback to invest. But based on the following chart, the current pullback might be temporary:
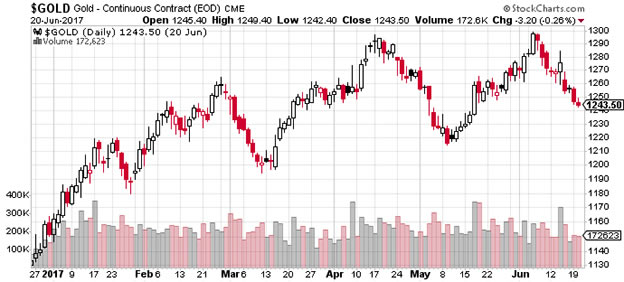
After gold started this year at $1,150 per ounce, it has moved in a “two steps forward and one back” fashion. Each new, higher support level that is tested and holds gives the market more resilience—and investors more confidence to take a position. It also serves to shake out those who panic and sell at the first sign of weakness, only to buy back in at higher prices down the road.
If this pattern continues through the remainder of 2017, we’ll likely see gold prices well north of $1,300, potentially approaching $1,400 by mid-2018.
Armed with the knowledge that the lows of the year—along with the lowest bullion premiums—usually occur during the late spring to early summer months, an investor can take the contrarian approach and “buy low” right now.
Get A Free Ebook On Precious Metals Investing
Before you buy physical gold, make sure to do your homework first. You’ll find everything you need to know in the definitive ebook, Investing in Precious Metals 101: which type of gold you should buy and which type you should stay away from, where to securely store your gold, why pools aren’t safe places, and much more. Click here to get your free copy now.
© 2017 Copyright Hard Assets Alliance - All Rights Reserved Disclaimer: The above is a matter of opinion provided for general information purposes only and is not intended as investment advice. Information and analysis above are derived from sources and utilising methods believed to be reliable,but we cannot accept responsibility for any losses you may incur as a result of this analysis. Individuals should consult with their personal financial advisors.
© 2005-2022 http://www.MarketOracle.co.uk - The Market Oracle is a FREE Daily Financial Markets Analysis & Forecasting online publication.