LOG 0.786 support in CRUDE OIL and COCOA
Commodities / Commodities Trading Jun 22, 2017 - 02:31 PM GMTBy: Stephen_Cox
 Originally written in the Wednesday JUN 21 MRI 3D Report,
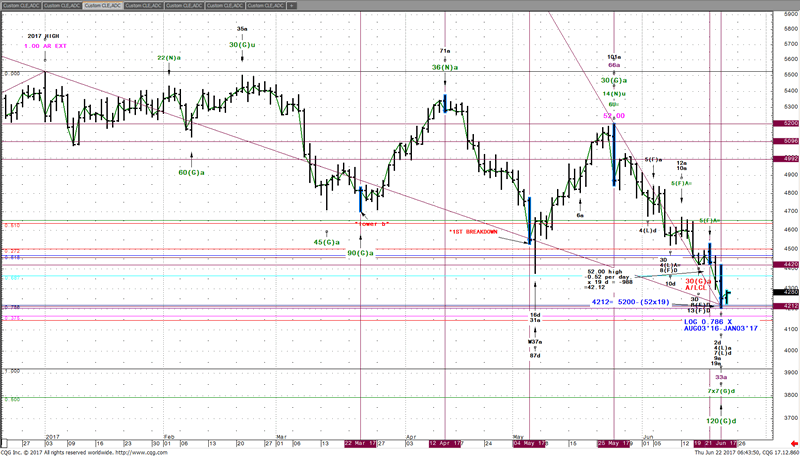
CRUDE OIL GROUP- CLQ 17 (4253): (W.D. GANN): Today is 19 trading days down from 52.00. 52×19= 988 Subtract 988 from 52.00 = 42.12 = the square of TIME and PRICE. Today’s low = 42.05.
TIME: Today is 33a/May04 LOW, 7×7(G)d/APR12 TOP and 120(G)d/55.24 Jan03 TOP

PRICE: LOG 0.786 X AUG03’16-JAN03’17= 42.18 The 0.796 Fail point below 42.03 wasn’t violated.
BUY 1 CLN MKT (currently 42.58)/ SELL 1 CLN 41.99 STOP GTC
________________________________________________________________________
Cocoa commentary is added.
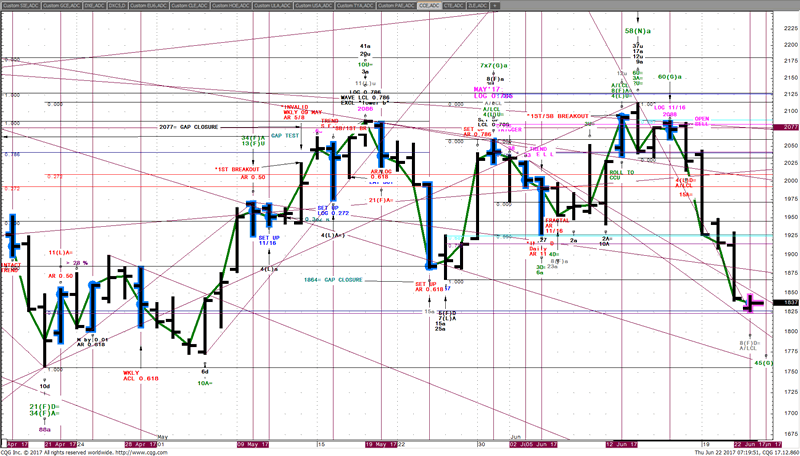
Cocoa- CCU 17 (18.43): In the last 4 full trading days since MRI 3D identified Cocoa wanted to be SHORTED on Friday’s 2080 OPEN (with < $150 per contract RISK) it has collapsed to the current 1840 area- about $2,400 per contract profit. Now Active Daily CCN 17 has bounced a little on LOG 0.786 support. Some defensive profits and further tightening of protective GTC STOPS to 1853 is recommended.
Here’s the chart:

In closing, let’s mention candlestick charts, while respected, are still arithmetic. MRI 3D studies all four separate chart frames, AR, LOG, ACL and LCL for PRICE and closing line frames ACL/ LCL and bar chart frames AR/LOG for TIME. >70 % of MRI 3D signals originate outside the arithmetic bar chart!
My 40 years experience in futures trading futures trading has taught me a 4 most important things:
- TIME is as important as PRICE.
- It’s vital to study TIME and PRICE in ALL 4 chart frames ACL, LCL, AR and LOG
- The best trades risk small to very small amounts compared to potential reward as average win to loss ratio is actually more important than just the percentage of winning trades!
- The NAME of the chart, as long as it’s reasonably liquid matters not one bit. What matters is the profits a market shares withy those that get to know it well.
Witten and published by Stephen Cox, founder of MRI Trading Signals and developer of MRI 3D TIME PRICE analysis within DEPTH of 4 Chart Frames- 3 of them beyond the arithmetic bar chart finding > 70 % of signals invisible to everyone else.
Video Introduction - https://mritradingsignals.com/the-science-of-mri-3d/
MRI Trading Signals Home Page - https://mritradingsignals.com/
Stephen Cox
Stephen Cox is a 4 decade trader and analyst who first started teaching his TIME and PRICE methods in 1989. MRI 3D is the culmination of his work in Time, Price and the 3rd dimension DEPTH. The MRI Trading Signals Subscription is purely performance based. The only way we keep our fee is by delivering 6%+ return in our hypothetical account, during the 30 Days subscription.
© 2017 Copyright Stephen Cox - All Rights Reserved Disclaimer: This is an paid advertorial. The above is a matter of opinion provided for general information purposes only and is not intended as investment advice. Information and analysis above are derived from sources and utilising methods believed to be reliable, but we cannot accept responsibility for any losses you may incur as a result of this analysis. Individuals should consult with their personal financial advisors.
© 2005-2022 http://www.MarketOracle.co.uk - The Market Oracle is a FREE Daily Financial Markets Analysis & Forecasting online publication.


