7 Signs You Should Add Gold To Your Portfolio Now
Commodities / Gold and Silver 2017 Jun 19, 2017 - 03:58 PM GMTBy: HAA
 Stephen McBride : Gold got crushed in the post-election rally, but a little over five months into 2017, the yellow metal is up 10.5%—making it one of the best-performing assets of the year so far.
While the outlook for the US economy is more positive than it was 12 months ago, if we zoom out for a moment, the big picture “ain’t so rosy.”
Gold has historically done well in times of uncertainty and panic… and with these seven worrisome signs, there could be plenty ahead.
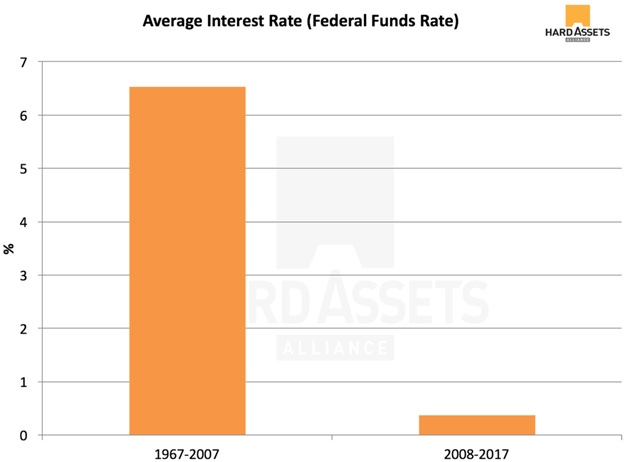
#1: Interest Rates Are Still Near Record Lows
Source: St. Louis Fed
In the wake of the financial crisis, the Fed lowered the federal funds rate—the main determinate of interest rates—to 0%. That zero-interest-rate-policy (ZIRP) has had wide-ranging implications for conservative investors.
And even though the Fed has been hiking rates recently, rates are still nowhere near a range that would provide savers and income investors the healthy 4–6% yields they saw before the 2008 Financial Crisis.
Gone are the days when people could keep their savings in a bank account and watch their money compound. This is also a major problem for pension funds (and retirees) that rely on high-grade investments like US Treasuries to earn returns.
Which brings us to…
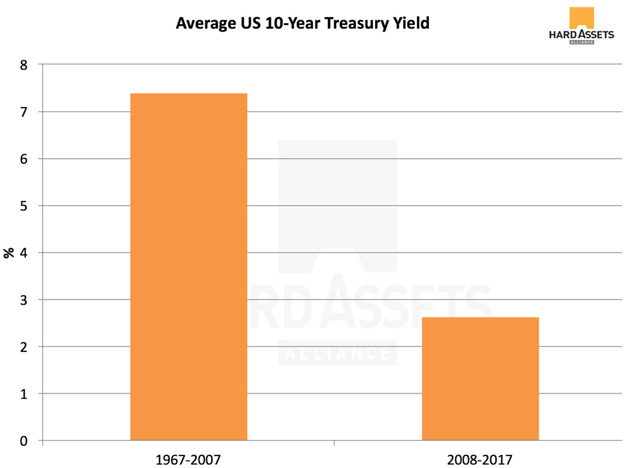
#2: Bonds Offer Measly Returns
Source: St. Louis Fed
A direct consequence of the Fed’s ZIRP is that bond yields have collapsed.
Although the benchmark US 10-year Treasury yield is up around 60% from its July 2016 lows, it’s still way below its 40-year average.
Meager returns on offer have pushed investors into riskier assets in search of decent yield. That includes dividend stocks, which have seen a huge influx of capital.
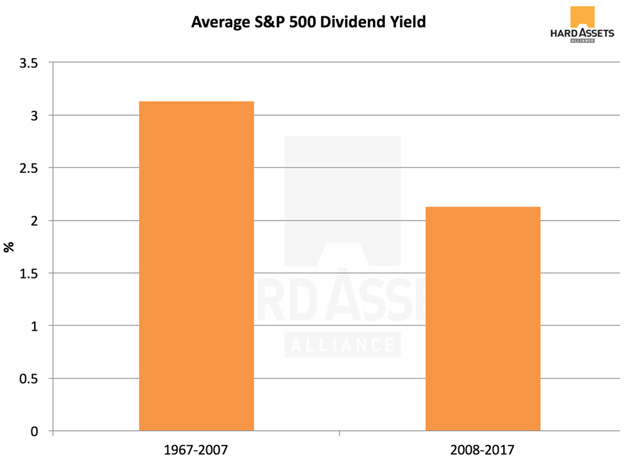
#3: Dividend Stocks Aren’t What They Used To Be
Source: multpl
As ZIRP sent bond yields south, investors piled into dividend-paying stocks as a way to generate returns. A direct consequence of this is that dividend yields on S&P 500 stocks have fallen to 1.91% and are now 32% below their long-term average.
Along with falling yields, investors who want to buy income-producing stocks these days are facing rich valuations. The average price-to-earnings ratio of the S&P 500 Dividend Aristocrats ETF (NOBL) is 21.1—higher than that of the broader S&P 500 index. An ETF tracking that index, SPDR S&P 500 ETF (SPY), has an average P/E ratio of 18.7. This number is itself high, which only reinforces the point that dividend-paying stocks have reached unsustainable levels of valuation.
As such, dividend stocks are richly valued and a poor alternative to bonds today, especially as they are reliant on economic growth. And, well…
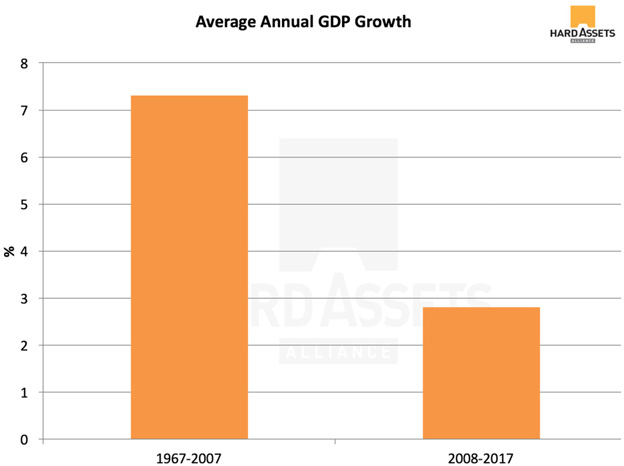
#4: Economic Growth Is Anemic
Source: St. Louis Fed
Between 1967 and 2007, the US economy grew at an average nominal rate of 7.3% per annum. However, in the last nine years, GDP growth has averaged just 2.8%.
President Trump said he can get the economy growing “bigly” again. But that’s unlikely, given major barriers to growth, such as a massive debt burden…
And it looks like he will have to face the fact that US economic growth is losing its momentum. Second-quarter GDP growth projections were lowered by Wall Street analysts and the Fed forecasting arms alike. Morgan Stanley revised its 2Q17 GDP forecast to 2.5% while the Atlanta Fed has dropped its second-quarter number from 3.4% to 3%.
Whether Mr. Trump can reverse this trend is yet to be seen. But it appears that he is looking at an uphill battle.
#5: The Federal Debt Has Exploded
Source: St. Louis Fed
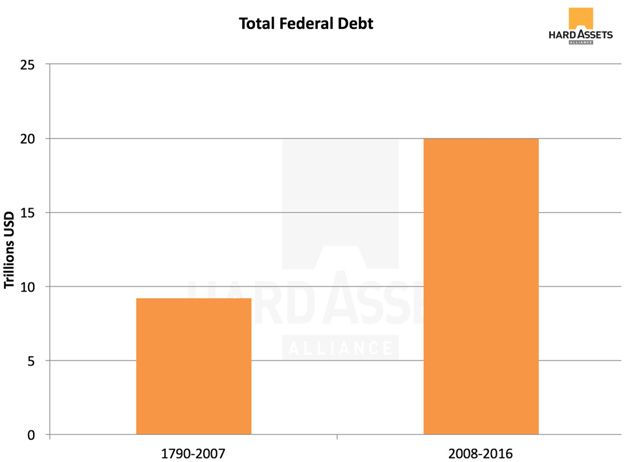
From George Washington, to George W., the federal debt went from $0 to $9.2 trillion. Since 2008, US government debt has skyrocketed to $19.85 trillion—a 116% increase in just eight years.
The non-partisan Congressional Budget Office (CBO) projects $10 trillion will be added to the federal debt over the next decade and estimates the cost of servicing the debt will triple over the next 10 years. That would bring interest payments alone to over $600 billion per annum.
For some context, that’s more than the total 2016 outlays for the Department of Defense and Education… combined.
#6: The Dollar Has Lost 87% Of Its Value
Source: St. Louis Fed
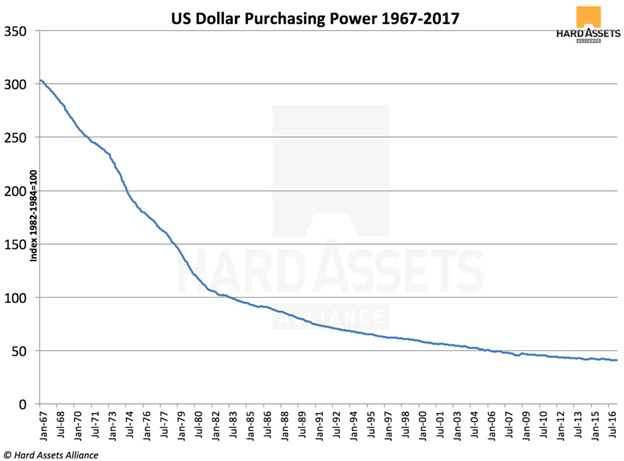
The US dollar may be rising against other fiat currencies like the euro and the yen, but its purchasing power has fallen 86.5% in 50 years.
The dollar’s decline has slowed somewhat in the last decade. However, with the Federal Reserve doing its level best to create inflation, you can be sure it will continue.
But there’s something that may not continue for much longer…
#7: We Are Overdue For A Bear Market
Source: S&P Global
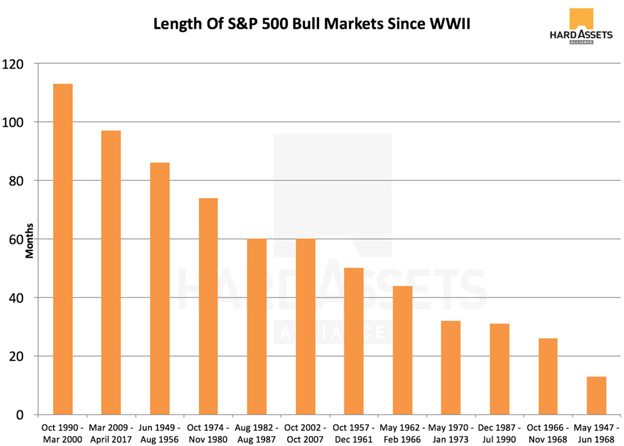
In March, the bull market in common stocks celebrates its eighth birthday—making it the second longest of its kind in US history. With the current bull run having exceeded the average length by over three years, it may be time to take some money off the table.
So, how can savers and investors protect their wealth from any negative consequences that could arise from these unhealthy trends?
Now Is The Time Add Gold To Your Portfolio
With the measly returns offered up by bonds, an overextended bull market, and a bleak economic outlook, adding gold to your portfolio is a wise move.
Gold bullion has proven to be a store of value and a reliable wealth preservation tool over many centuries… unlike the dollar. In the event of a stock selloff, it can serve as “portfolio insurance.”
Even if markets continue to rise in the interim, gold will do well. Since late 2015, the yellow metal has outperformed the S&P 500 by 30%.
Placing 5%–10% of your assets in bullion adds a crisis-nullifier to your portfolio… and the current setup certainly lends itself to it.
Get A Free Ebook On Precious Metals Investing
It’s prudent to add some physical gold to your portfolio now. But before you buy, make sure to do your homework first. Get the comprehensive ebook, Investing in Precious Metals 101, and learn more about which type of gold to buy and which to stay away from… how to spot common scams and mistakes inexperienced investors fall prey to… the best storage options… why pools aren’t safe places… and more. Click here to get your free copy now.
© 2017 Copyright Hard Assets Alliance - All Rights Reserved Disclaimer: The above is a matter of opinion provided for general information purposes only and is not intended as investment advice. Information and analysis above are derived from sources and utilising methods believed to be reliable,but we cannot accept responsibility for any losses you may incur as a result of this analysis. Individuals should consult with their personal financial advisors.
© 2005-2022 http://www.MarketOracle.co.uk - The Market Oracle is a FREE Daily Financial Markets Analysis & Forecasting online publication.


