


US Bonds and Related Market Indicators
Interest-Rates / US Bonds Jun 19, 2017 - 03:28 PM GMTBy: Gary_Tanashian

 The June 18 edition of Notes From the Rabbit Hole has a few less stock charts this week in order to ramp up the macro talk, which appeared periodically through the report; but especially in the Precious Metals and Bonds segments. Excerpted from NFTRH 452…
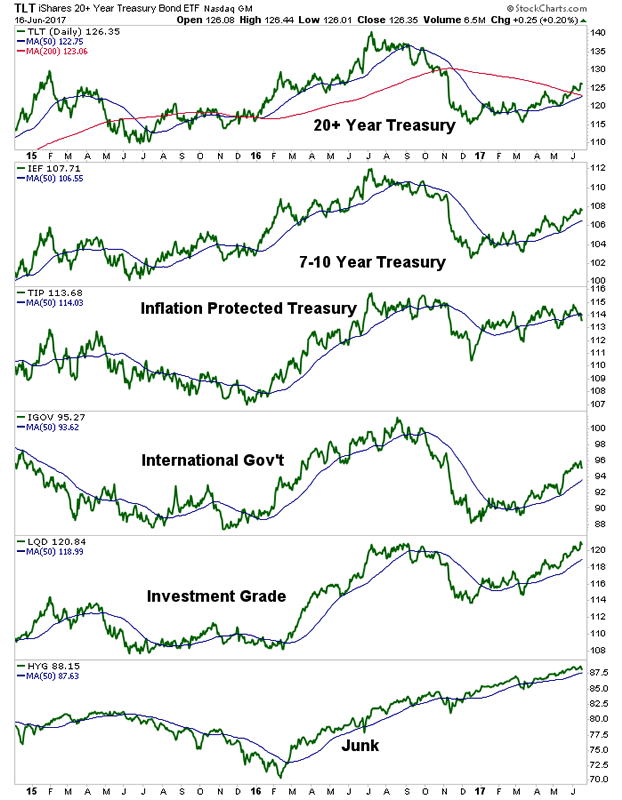
Bonds & Related Indicators (and more macro discussion)
The target for TLT continues to be around 129. Treasury bonds are in bull trends (remember back a few months ago to all the bond hatred in the media). How does an eventual decline in bonds square with what we just noted above regarding Q4 2008? [work done in the preceding Precious Metals segment] Treasury bonds were a wonderfully bullish asset during Armageddon ’08 and who’s to say that an upside blow off may not be coming sooner rather than later amid massively over bullish sentiment? I mean, there is certainly no stop sign at our 129 target. Sentiment, as we are all too aware, can take a long while to manifest in pricing.
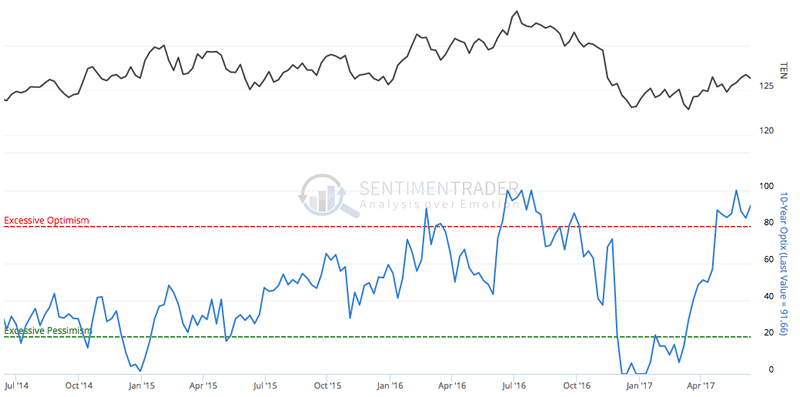
And that sentiment (and CoT) data are still pointing to a bearish bond future. Public optimism is still extremely over bullish on the 10yr bond.
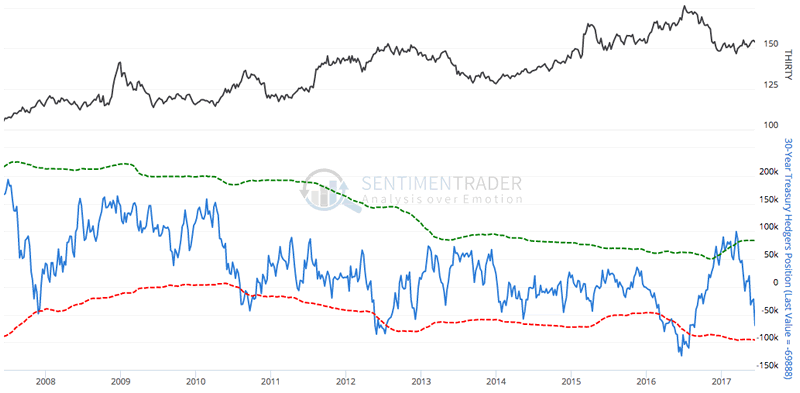
Graphics courtesy of Sentimentrader…
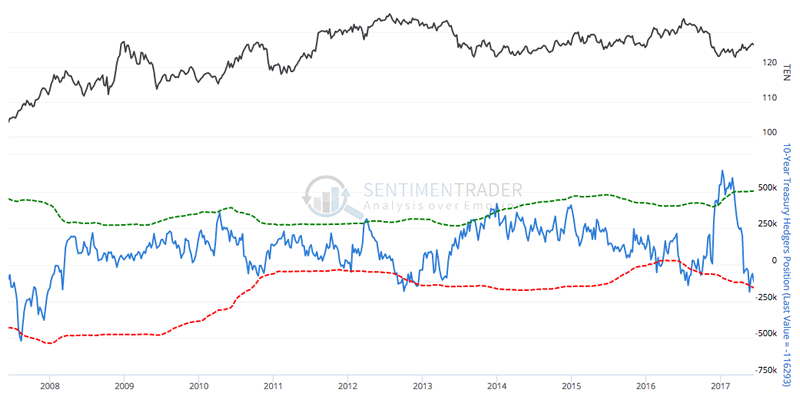
Commercial hedging is still in a net short state, also bearish for the 10yr bond.
Now you will recall that the 30yr had been a holdout to the bear case as its Optimism and Commercial hedging data were only so-so, not too hot and not too cold. Well, public optimism is headed directly for the red line on the 30yr.
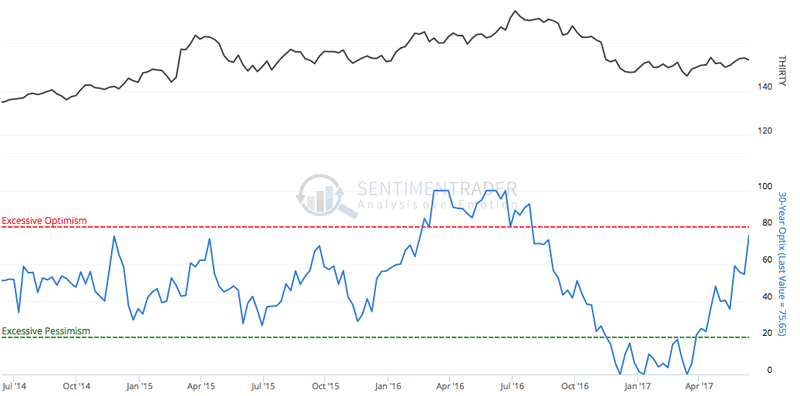
And Commercial hedgers are now net short the 30yr and driving it toward extreme territory.
Perhaps the 30yr will prove to have been a better timer when all is said and done. I don’t pretend to know the future, but am simply stating there is a scenario where the dynamics in Treasury bonds can also fit the scenario noted in the Precious Metals segment. If bonds blow off into a deflationary episode as they did in Q4 2008, what could come next is an inflationary episode, as it did in 2009. That would drive yields up.
Folks, my job is to illustrate rational scenarios and yours is to keep a grain of salt.
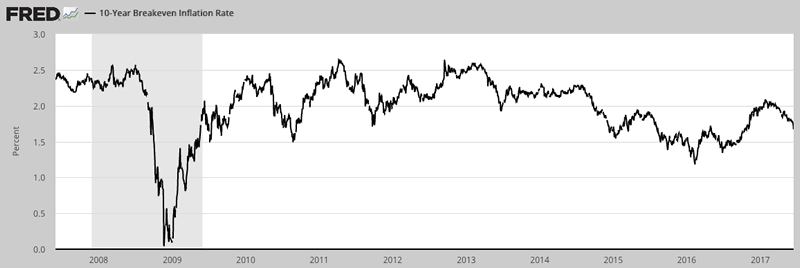
We have been using the TIP/IEF ratio as an ‘inflation expectations’ (IE) indicator. It has been declining for all of 2017 after rising in the Trump-fueled ‘fiscal reflation’ trade to end 2016. You can see how inflation expectations crashed in Q4 2008. To further the point made above we became bullish in that period, first on the precious metals, then on commodities (oil and copper, as I recall) and later, stocks. The gold sector bottomed in the depths of the IE crash and then commodities bottomed after the ‘V’ bottom in IE.
Graphics courtesy of the St. Louis Fed…
Finally, let’s end with a dissimilarity to Q4 2008. Economic dislocations did not start happening until this [10yr-2yr] spread started to turn up and when it did turn up it was from much lower levels (sub-zero) than today.
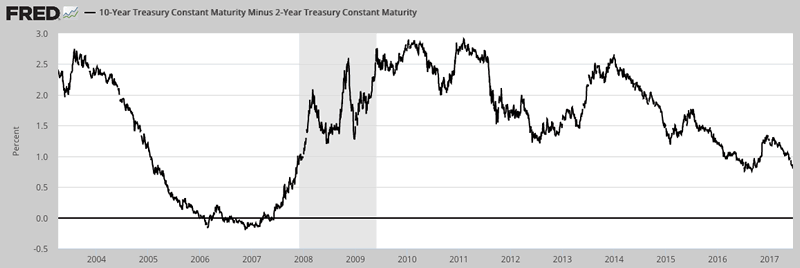
People who want to be bullish on stocks often talk about how the stock market is fine until the yield curve becomes inverted. In 2007, 10-2 went sub-zero and wallowed along down there well into 2007, before turning up. With that came the first signs of stress as Bear Sterns and Lehman Brothers started to blow up.
The question now is ‘who says the curve has to invert before the next up turn?’
Is that an etched in stone law of economics and finance? Given the stimulants injected into the system post-2008 I would not make a bet that all need be symmetrical and logical to history. Regardless, the bottom line is that if the curve starts to turn up we can be on alert for a negative liquidity event. Thus far, the curve remains in decline and all appears fine, for now. But if inflation expectations continue to tank… ?
Subscribe to NFTRH Premium for your 40-55 page weekly report, interim updates and NFTRH+ chart and trade ideas or the free eLetter for an introduction to our work. Or simply keep up to date with plenty of public content at NFTRH.com and Biiwii.com. Also, you can follow via Twitter ;@BiiwiiNFTRH, StockTwits, RSS or sign up to receive posts directly by email (right sidebar).
By Gary Tanashian
© 2017 Copyright Gary Tanashian - All Rights Reserved
Disclaimer: The above is a matter of opinion provided for general information purposes only and is not intended as investment advice. Information and analysis above are derived from sources and utilising methods believed to be reliable, but we cannot accept responsibility for any losses you may incur as a result of this analysis. Individuals should consult with their personal financial advisors.
Gary Tanashian Archive |
© 2005-2022 http://www.MarketOracle.co.uk - The Market Oracle is a FREE Daily Financial Markets Analysis & Forecasting online publication.