


DOLLAR has recently damaged GOLD and SILVER- viewed in MRI 3D charts
Commodities / Gold and Silver 2017 Jun 14, 2017 - 02:52 PM GMTBy: Stephen_Cox

 About 10 days ago MRI Trading Signals posted a FEATURED article on the bottom of our home page titled DOLLAR CROSSROAD? In it are 20 charts showing the potential impact a Dollar Index bottom would have on Gold and other exogenous markets.
This article is an update. So far this week, DX has traded inside last week’s narrow range. Once that changes Gold and Silver will react- perhaps dramatically. Tomorrow, June 14, the FOMC minutes are released.
The MRI 3D Report recommended last Wednesday evening to buy DXU17 @ 96.660 LMT with a 0.220 sized 96.440 STOP GTC. Friday showed to be a top (temporary?), so our updated 97.070 STOP GTC was elected Sunday and we’re flat thru the FOMC.
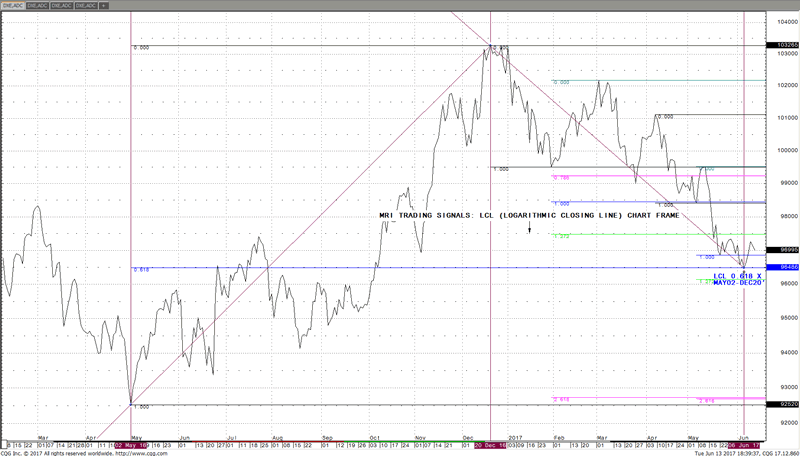
Let’s get to the heart of the topic. Take a look at how just a slight uptick in DX on its MRI 3D buy signal, within the LCL (Logarithmic Closing Line) chart frame, has affected Gold (GCQ 17) and Silver (SIN17) dramatically to the downside. It’s T I M E, now more than ever, to listen to what MRI 3D charts are telling us.
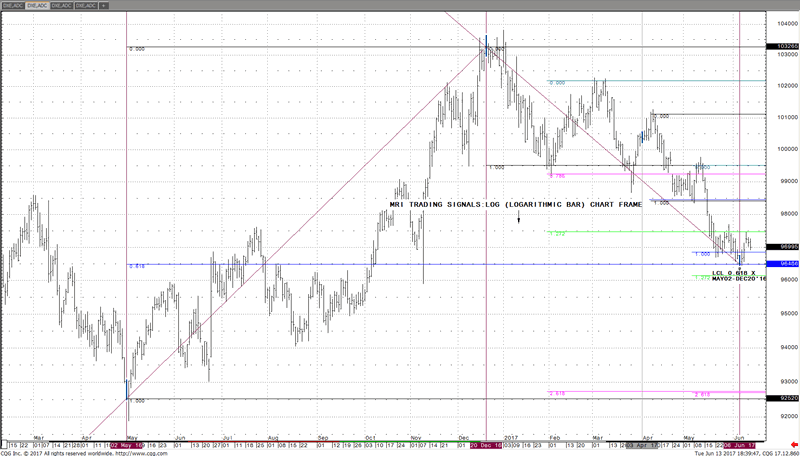
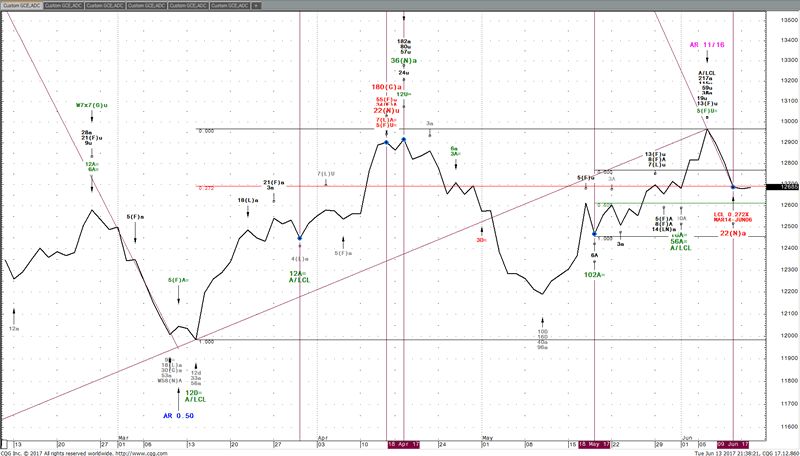
The following 4 DX Daily charts show their TIME and PRICE, within 2 of 4 Chart Frames MRI studies. Last week on June 06, the DX Active Daily reached an important LCL 0.618 Fibonacci retracement, visible only in the LCL (Logarithmic Closing Line) Chart Frame.
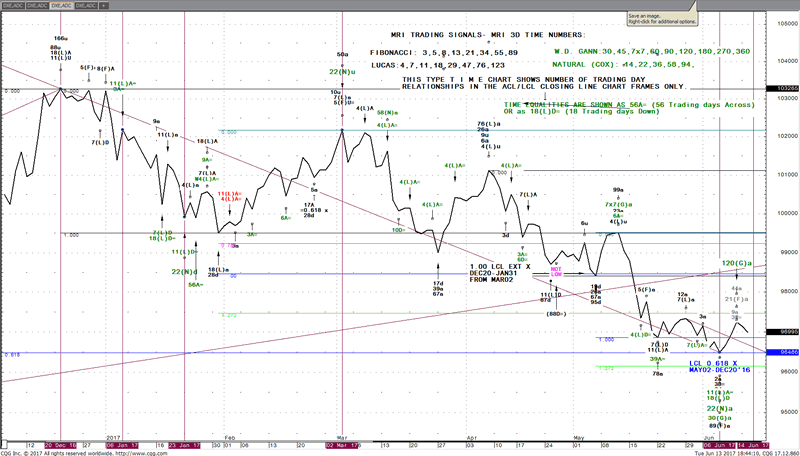
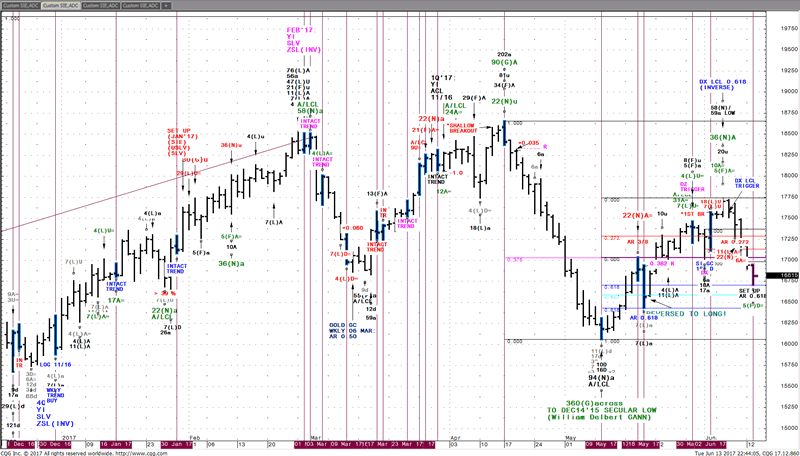
MRI Trading Signals TIME and PRICE work within DEPTH of 4 separate chart frames (MRI 3D) finds the > 70 % of signals beyond the AR (Arithmetic Bar Chart), most traders never study. Additionally, MRI’s 4 source based (Fibonacci, Lucas, W.D. Gann and my own Natural) TIME studies prove to be of absolute importance in MRI 3D analysis, utilizing both bar chart as well as closing line chart frames. On Chart # 3 an explanation of our TIME numbers and natural sequences are annotated.
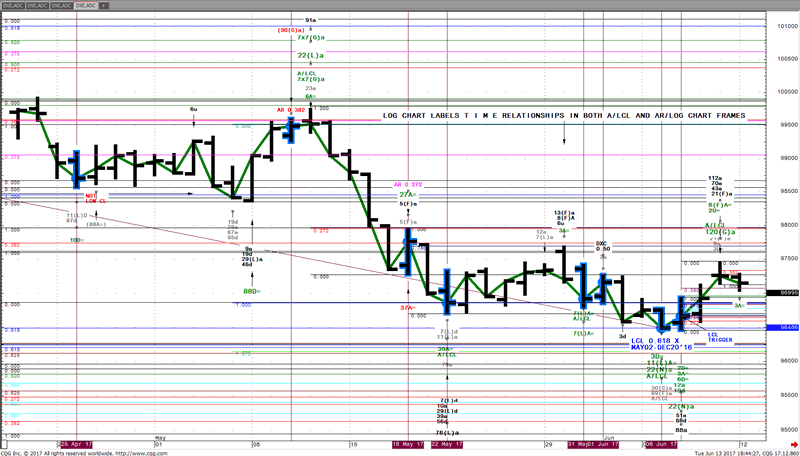
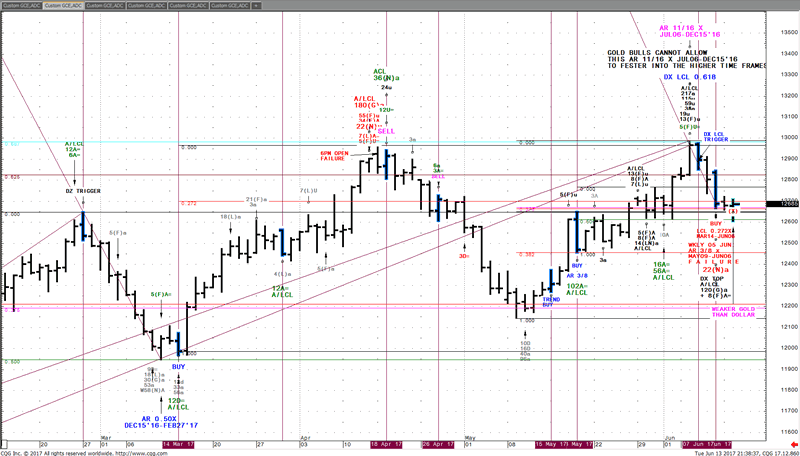
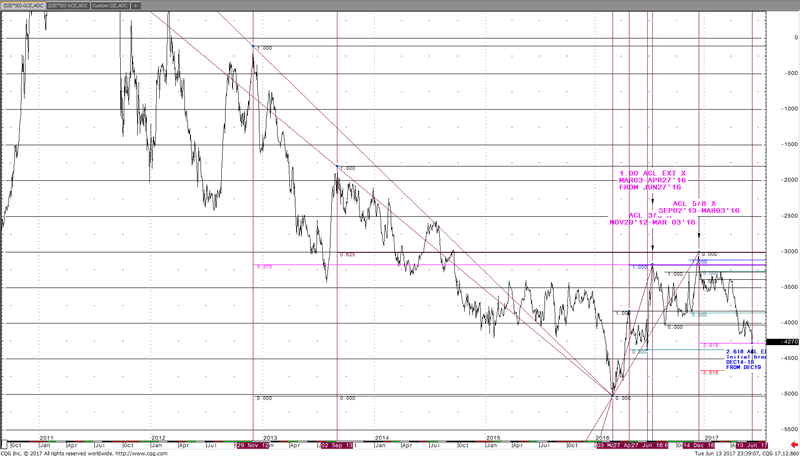
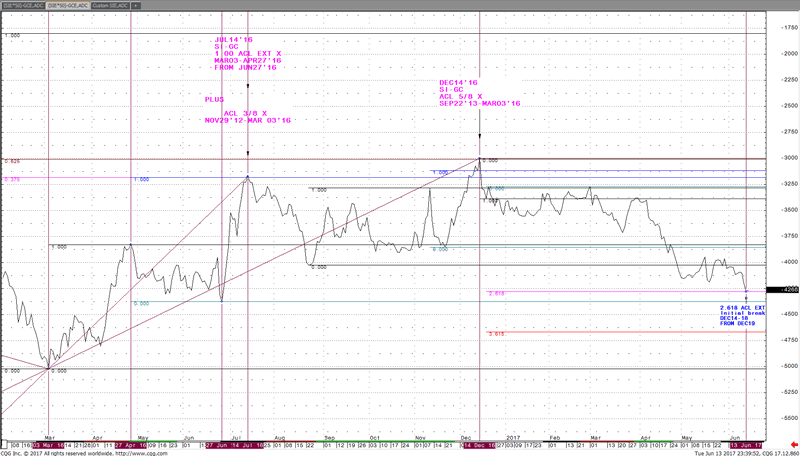
Now let’s take a look within the next 2 charts the huge bearish effect this new potential Dollar Index bottom has exerted on GOLD, since the DX, Daily LCL 0.618 X MAY02-DEC20’16 on JUN06 and LCL Trigger on JUN 07. Then notice since last Friday’s DOLLAR TOP, just how little bullish effect this DX drop has had on GOLD. Especially unimpressive is for GOLD to present on Friday Daily ACL 0.272 x MAR14-JUN06 plus AR 3/8 x MAY09-JUN06 on, which 500 points was risked on Sunday evening and stopped out Monday night.
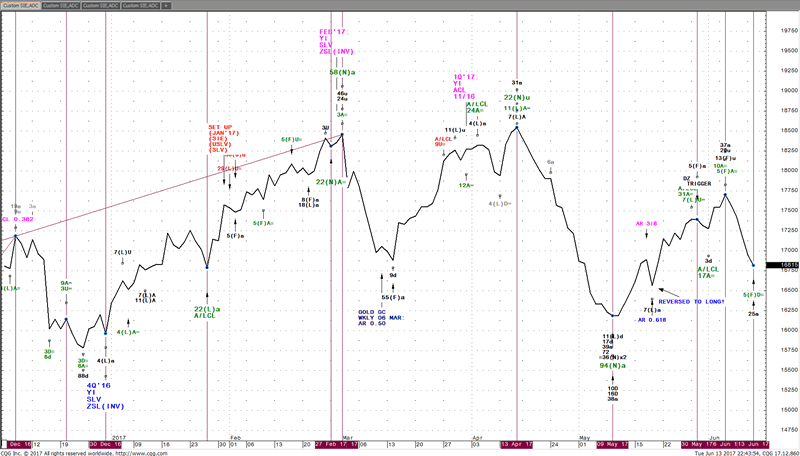
Following the 2 Gold charts are 2 Silver Charts and their 4 source based MRI 3D TIME studies.
GCE (Daily) ACL TIME
GC (Daily) AR 11/16 + TIME
SI (Daily) TIME in ACL
SI (Daily) TIME in AR
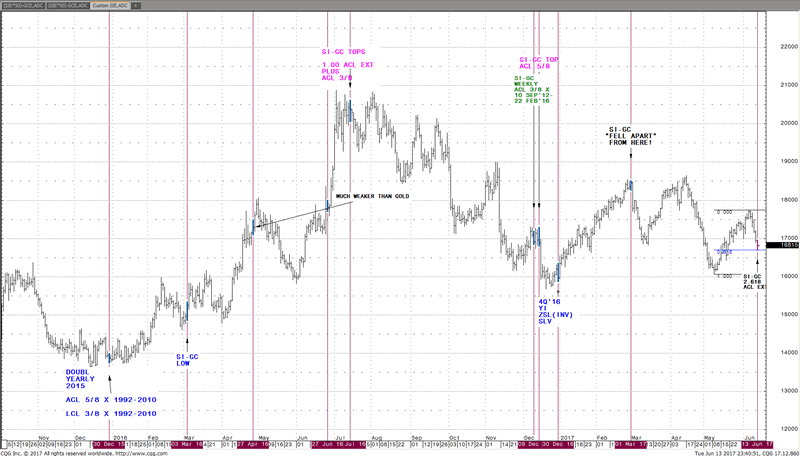
In conclusion, in observation just how much weaker Silver has been in comparison to Gold since last December the bullish argument becomes debatable. In the last 3 charts we’ve taken our custom study subtracting 1 GOLD from 1 SILVER in the Daily TIME FRAME, within its ACL CHART FRAME. If the DOLLAR has bottomed here and gets a tailwind watch out below in the GOLD and SILVER related space. Either way, we’ll continue to allow the markets to tell us their TIME and PRICE stories, within their 4 chart frames of DEPTH.
SI-GC (Daily) ACL SELLS
SI-GC (Daily) ACL Zoom
SI (daily) ACL SI-GC SELLS
Witten and published by Stephen Cox, founder of MRI Trading Signals and developer of MRI 3D TIME PRICE analysis within DEPTH of 4 Chart Frames- 3 of them beyond the arithmetic bar chart finding > 70 % of signals invisible to everyone else.
Video Introduction - https://mritradingsignals.com/the-science-of-mri-3d/
MRI Trading Signals Home Page - https://mritradingsignals.com/
Stephen Cox
Stephen Cox is a 4 decade trader and analyst who first started teaching his TIME and PRICE methods in 1989. MRI 3D is the culmination of his work in Time, Price and the 3rd dimension DEPTH. The MRI Trading Signals Subscription is purely performance based. The only way we keep our fee is by delivering 6%+ return in our hypothetical account, during the 30 Days subscription.
© 2017 Copyright Stephen Cox - All Rights Reserved Disclaimer: This is an paid advertorial. The above is a matter of opinion provided for general information purposes only and is not intended as investment advice. Information and analysis above are derived from sources and utilising methods believed to be reliable, but we cannot accept responsibility for any losses you may incur as a result of this analysis. Individuals should consult with their personal financial advisors.
© 2005-2022 http://www.MarketOracle.co.uk - The Market Oracle is a FREE Daily Financial Markets Analysis & Forecasting online publication.