


Gold Price Failed to Break above 1.295.44 Resistance
Commodities / Gold and Silver 2017 Jun 12, 2017 - 10:37 AM GMTBy: Franco_Shao

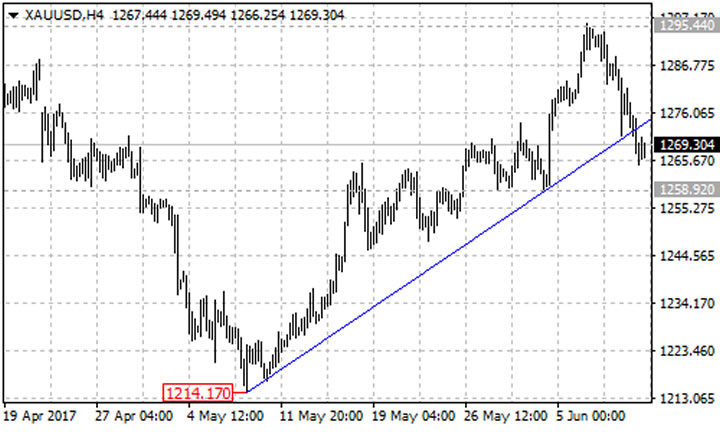
 Under pressure by the resistance of the April 17 high of 1295.44, XAUUSD pulled back to 1265 and broke below the bullish trend line from the May 9 low of 1214.17 to the June 2 low of 1258.92 at 1270 on its 4-hour chart, suggesting that the short term uptrend from 1214.17 is complete.
On the downside
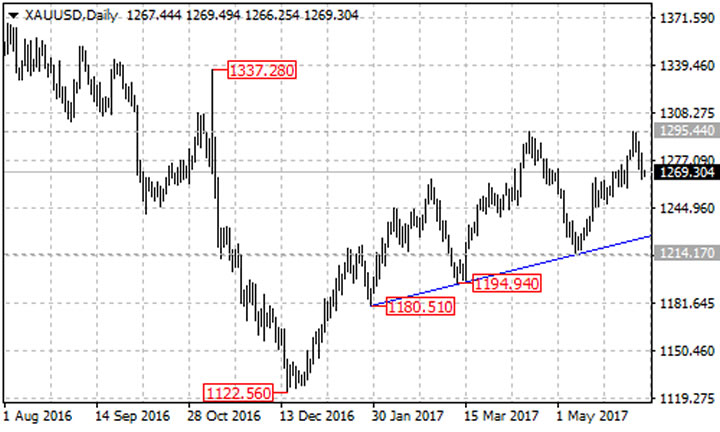
The pair is expected to find its first support at 1258.92, a break through this level could take price to the next support level at the 61.8% Fibonacci retracement taken from 1214.17 to 1295.44 at 1245. The key support is located at the ascending trend line from the January 27 low of 1180.51 to the March 10 low of 1194.94 on its daily chart, now at around 1225. A clear break below this trend line support will indicate that the uptrend from the December 2016 low of 1122.56 had completed, then the following bearish movement could bring price back into 1160 zone.
On the upside
As long as the Gold price is above the rising trend line on the daily chart, the fall from June 7 could be treated as correction of the uptrend from 1122.56 and another rise towards 1400 is still possible after the correction pullback. Near term resistance is at 1295.44, a break of this level will signal resumption of the uptrend, this could take price to the next resistance level of the November 2016 high of 1337.28.
Technical levels
Support levels: 1258.92 (near term support), 1245 (61.8% Fibonacci retracement), 1225 (the trend line on daily chart).
Resistance levels: 1295.44 (near term resistance), 1337.28 (November 2016 high), 1375.11 (July 2016 high).
This article is written by Franco Shao, a senior analyst at ForexCycle.
© 2017 Copyright Franco Shao - All Rights Reserved Disclaimer: The above is a matter of opinion provided for general information purposes only and is not intended as investment advice. Information and analysis above are derived from sources and utilising methods believed to be reliable, but we cannot accept responsibility for any losses you may incur as a result of this analysis. Individuals should consult with their personal financial advisors.
© 2005-2022 http://www.MarketOracle.co.uk - The Market Oracle is a FREE Daily Financial Markets Analysis & Forecasting online publication.