Credit Downgrades May Prompt Stock Market Capital Shift
Stock-Markets / Stock Market 2017 May 26, 2017 - 10:22 AM GMTBy: Chris_Vermeulen
 Recent news regarding Moody’s credit downgrades in China will likely continue to roil the global markets and present multiple unique opportunities for strategic investors. As debt concerns grow throughout some areas of Asia and new US policy efforts shake up some common perceptions, a shift in capital is likely to occur over the next few months.
Today, I read about massive layoffs in India’s technology sector as a reaction to decreasing engagement of foreign IT services/support is a result of President Trump’s policies. When we take this news in combination with Moody’s credit downgrades for China and the fact that almost all of South East Asia is interconnected in terms of economy and trade, we begin to see a picture that is fairly clear in terms of transitional economic shifts.
If India and a portion of South East Asia suffer a technology driven economic contraction as a result of US policy shifts, how can we evaluate the approximately $900+ billion economic shift that may be unfolding. As this unfolds, unemployment, consumer spending and growth rates will differ vastly from projected levels. A minor 2~3% decrease in business activity for the Asian technology sector may have massive results if it persists over a longer term period of time (say 3~7+ years). This is exactly why we, as investors, need to be aware of these economic shifts and be able to profit from these moves.
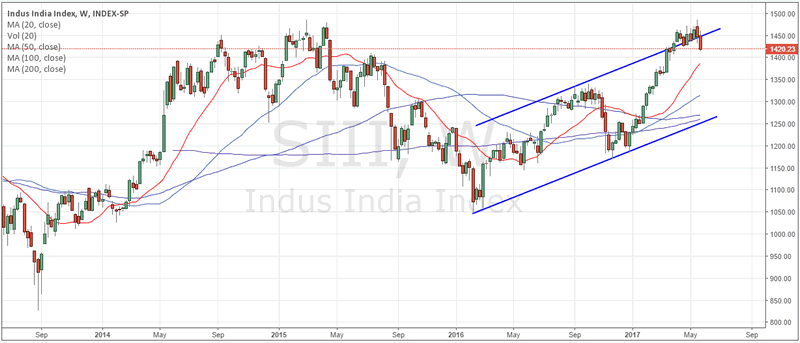
SIII (Indian Index)
The SIII has already rotated nearly 2% over the past two months from a near perfect Double-Top. The potential for a 10~20% market correction is rather strong knowing that massive layoffs in India will put further pressure on economic growth, consumer spending and economic outlook.

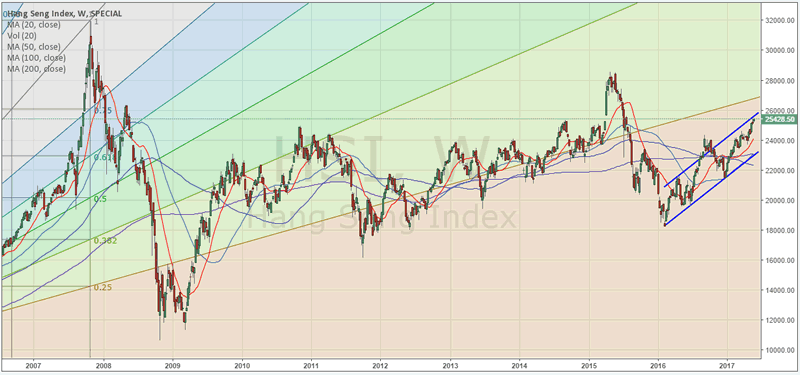
HSI (HangSeng Index)
The HSI is not showing signs of any market corrections yet. This is likely due to the fact that China is currently experiencing a technology/stock market bubble effect as a result of recent wealth creation. I would expect that any extended contraction in the bulk of South East Asia will also be seen and felt in China.

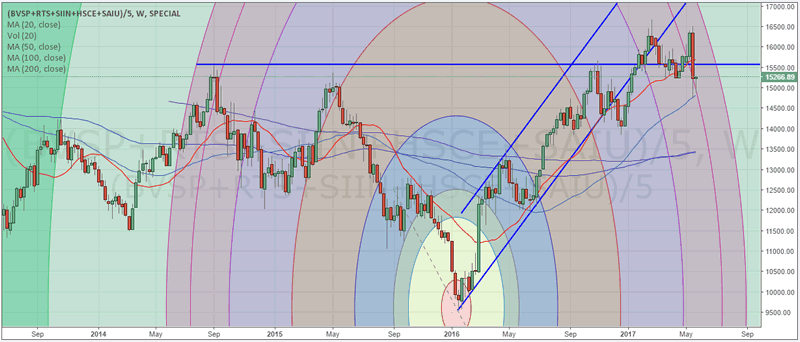
Custom BRICs Index
A custom BRICs Index shows a more defined price rotation and a clear series of lower high and lower low price trends. This would indicate that that the BRICs economies may have quite a large range of price volatility going forward with a potential for a 20~30% decline over the next few months. (

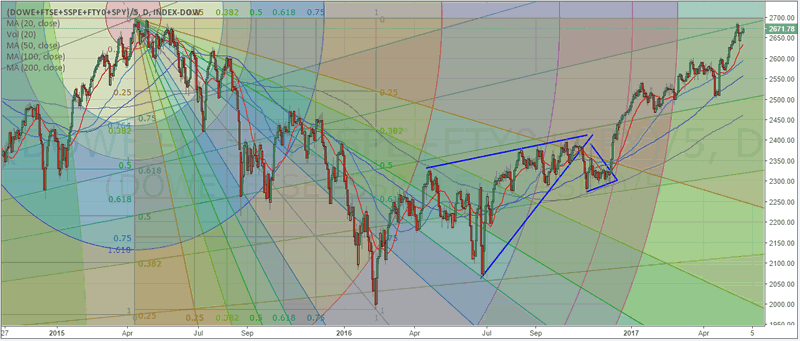
US/EU Custom Index
As this potential economic shift plays out, I suspect the US and European market will see a dramatic influx of capital investment and renewed economic activity. This chart of a custom index of US and EU indexes clearly shows the strength of these markets in relation to the economic shift that has been transacting. It is clear to see that shortly after the US Presidential elections (Nov 8th, 2017), this index has shot up 15%+ and has begun to retest 2015 highs. Could this be a massive double top to form later this year? It’s very possible.

Watch for this economic shift to continue to play out over the next 6~12+ months and watch for unique opportunities that will be presented by these moves. We alert our clients to these types of opportunities every day at ActiveTradingPartners.com and attempt to keep our members aware of strong trading signals using our proprietary Momentum Reversal Method trading system.
TRADES THIS MONTH:
ERY 4.75%, in 2 Days
SLV 3.2%, in 6 Days
MOBL 15%, in 7 Days
FOLD 9.5% in 40 Days
We invite anyone interested in this type of opportunity to visit our website to learn more
Chris Vermeulenwww.TheGoldAndOilGuy.com – Daily Market Forecast Video & ETFs
www.ActiveTradingPartners.com – Stock & 3x ETFs
Chris Vermeulen is Founder of the popular trading site TheGoldAndOilGuy.com. There he shares his highly successful, low-risk trading method. For 7 years Chris has been a leader in teaching others to skillfully trade in gold, oil, and silver in both bull and bear markets. Subscribers to his service depend on Chris' uniquely consistent investment opportunities that carry exceptionally low risk and high return.
Disclaimer: Nothing in this report should be construed as a solicitation to buy or sell any securities mentioned. Technical Traders Ltd., its owners and the author of this report are not registered broker-dealers or financial advisors. Before investing in any securities, you should consult with your financial advisor and a registered broker-dealer. Never make an investment based solely on what you read in an online or printed report, including this report, especially if the investment involves a small, thinly-traded company that isn’t well known. Technical Traders Ltd. and the author of this report has been paid by Cardiff Energy Corp. In addition, the author owns shares of Cardiff Energy Corp. and would also benefit from volume and price appreciation of its stock. The information provided here within should not be construed as a financial analysis but rather as an advertisement. The author’s views and opinions regarding the companies featured in reports are his own views and are based on information that he has researched independently and has received, which the author assumes to be reliable. Technical Traders Ltd. and the author of this report do not guarantee the accuracy, completeness, or usefulness of any content of this report, nor its fitness for any particular purpose. Lastly, the author does not guarantee that any of the companies mentioned in the reports will perform as expected, and any comparisons made to other companies may not be valid or come into effect.
Chris Vermeulen Archive |
© 2005-2022 http://www.MarketOracle.co.uk - The Market Oracle is a FREE Daily Financial Markets Analysis & Forecasting online publication.


