


Gold Update…Shaking The Tree
Commodities / Gold and Silver 2017 May 19, 2017 - 10:48 AM GMT

 There is a pattern forming on gold which wasn’t there yesterday. With yesterday’s big move up and no follow through to the upside today there is a potential H&S top building out. Many times I will use a neckline symmetry line which is taken from the neckline and moved up to the top of the left shoulder to show the possible high for the right shoulder. There is another technique I use where I will use a horizontal line from the top of the left shoulder that can sometimes show the height for the right shoulder. Today’s high at 1265 matches the high for the left shoulder. I’ve been showing the possible neckline as a S&R line, but now after yesterday’s move it’s looking more like a possible neckline. The breakout will come into play around the 1220 area which will confirm the H&S top.
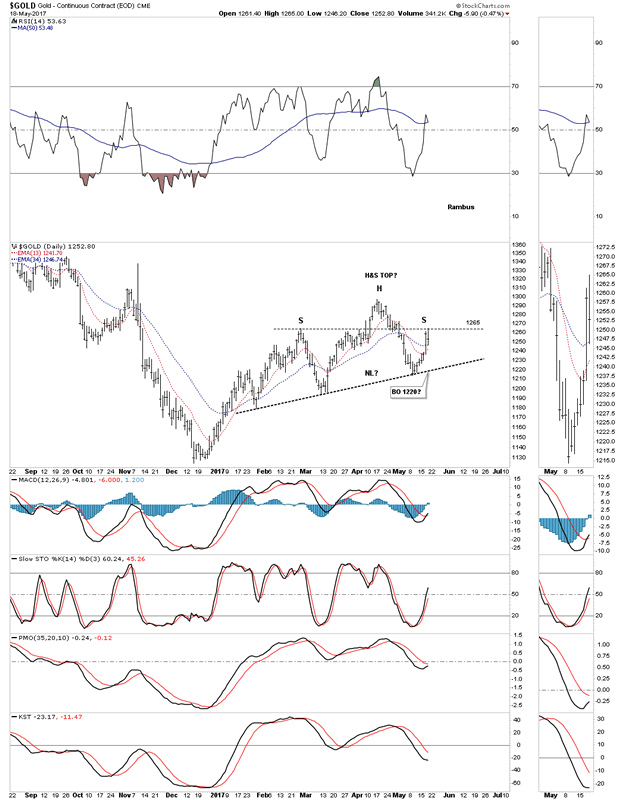
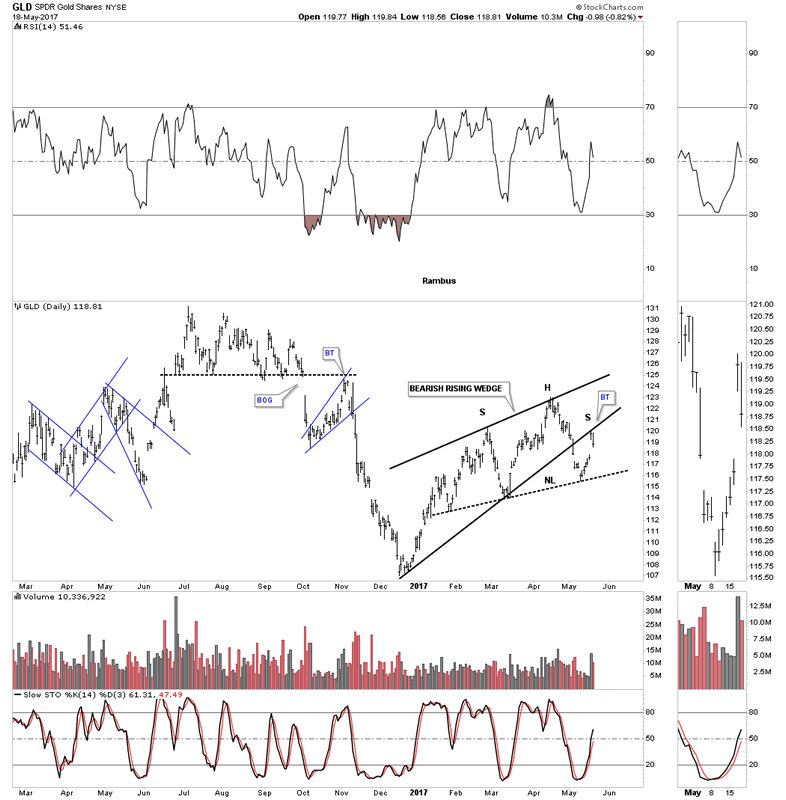
There is another technique I’ve shown you in the past that has to do with a wedge pattern. I’ve been showing you that gold has broken out of a bearish rising wedge with a breakout gap and a backtest today to the underside of the bottom rail. This technique I use shows how the left shoulder and head form inside the wedge and the backtest to the underside of the rising wedge forms the right shoulder. It ‘s still very early yet, but these two techniques show a strong possibility that gold may well be forming a H&S top.
Below is the PM combo chart which is showing yesterdays move may have been a strong backtest to the bottom rail of the triangle consolidation patterns as today’s price action closed below the bottom trendline. There were also several apex backtests which held resistance.
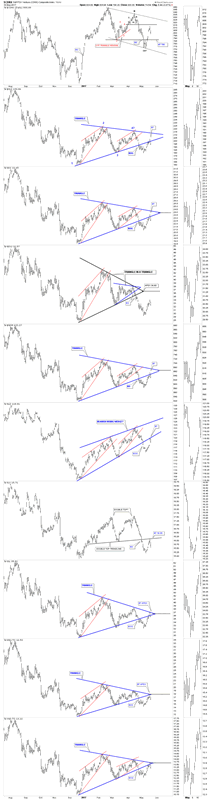
Yesterday I speculated on whether the gap opening was an exhaustion gap or a breakaway gap. With the price action trading back below the bottom rail of the triangle consolidation patterns it looks like we may have seen an exhaustion gap.
Based on that the possible exhaustion gap in play I’m going to jump back in and take an initial small position in the Kamikaze stocks. For most investors that’s almost an impossible thing to do, sell out one day and buy back in the next. Yesterday was called, shaking the bush day, to get the shorts to cover with what now looks like a strong backtest in place. Again this trade is not for everyone as the volatility is extreme in both directions. Only risk capital is used trading the Kamikaze stocks JNUG JDST DSLV and DGLD.
All the best
Gary (for Rambus Chartology)
FREE TRIAL - http://rambus1.com/?page_id=10
© 2017 Copyright Rambus- All Rights Reserved
Disclaimer: The above is a matter of opinion provided for general information purposes only and is not intended as investment advice. Information and analysis above are derived from sources and utilising methods believed to be reliable, but we cannot accept responsibility for any losses you may incur as a result of this analysis. Individuals should consult with their personal financial advisors.
© 2005-2022 http://www.MarketOracle.co.uk - The Market Oracle is a FREE Daily Financial Markets Analysis & Forecasting online publication.