


Alibaba Stock ( BABA ) Looking for a Pullback
Companies / Company Chart Analysis May 19, 2017 - 10:41 AM GMT

Alibaba Group Holding Limited (NYSE: BABA) is a Chinese e-commerce company that provides sales services via web portals. It also provides electronic payment services, a shopping search engine and data-centric cloud computing services. Alibaba is one of the largest Internet companies as its online sales & profits surpassed all US retailers (including Walmart, Amazon and eBay) combined in 2015 and it now considered as the world’s largest retailer surpassing Walmart.
Alibaba Shares recently managed to make new all time highs after breaking above 2014 peak $120 and investors are still looking for more gains to come. Let’s jump into the Elliott Wave technical analysis to see how bullish is it ?
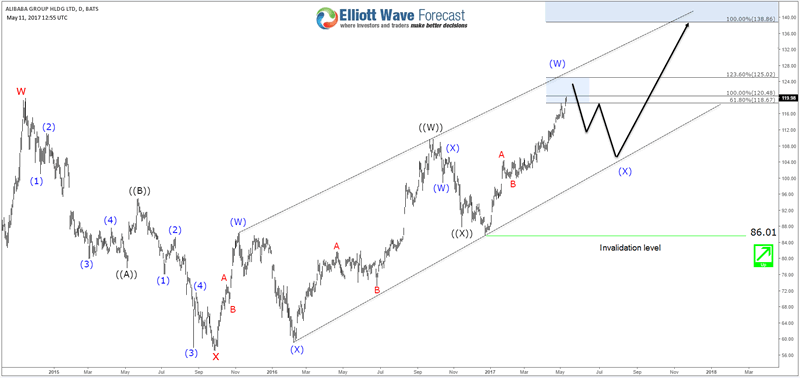
BABA Double Three Structure
Since 2015 low, BABA started trading in 3 waves move to the upside which currently is forming 5 swings sequence with divergence which we consider as an incomplete bullish sequence as part of a double three structure. So according to the swing structure , the stock is ending the 5th swing around equal legs area $120 – $125 from December 2016 low and it should then pullback in 3 waves against 86.01 low. The 6th swing pullback should ideally hold above the bullish channel to be able to resume the rally toward equal legs area $138 from September 2015.
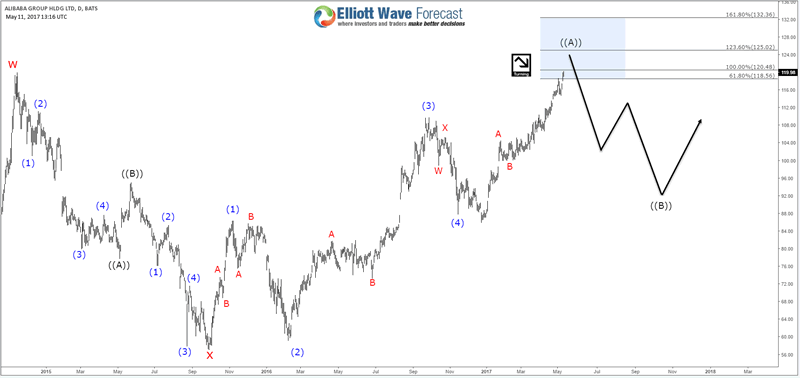
BABA Leading Diagonal Structure
The second scenario for BABA would be represented when the pivot at $86.01 low gives up later on, which will mean the stock has ended the cycle from from September 2015 low and in that case it can be counted as a leading diagonal because it has 5 corrective waves holding the divergence. Consequently , the correction can extend toward $90 area and take longer time before the stock resume the move to the upside.
Recap:
Alibaba Shares ( BABA ) has a daily bullish structure suggesting more upside in the future. However currently the stock has reached the extreme area $120 – $125 from December 2016 low so no matter which scenario will play out there will be a 3 waves pullback before buyers starts showing up again. Depending on the speed & structure of the correction we’ll know exactly which cycle has ended and where & when will be the ideal area to look for buying opportunities.
If you enjoyed this article, feel free to take a look at our Technical Blog and also check the Chart of The Day .
For further information on how to trade forex, indices, commodities and stocks using Elliott Wave technique , try us 14 days for FREE . You will get access to our Professional Elliott Wave analysis in 4 different time frames, Daily Elliott Wave Setup Videos , Live Trading Room and 2 Live Analysis Session done by our Expert Analysts every day, 24 hour chat room support, Weekly Technical videos and much more so if you are not a member yet, use this opportunity and sign up to get your FREE trial
By Ayoub Ben Rejeb
https://elliottwave-forecast.com
ElliottWave-Forecast has built its reputation on accurate technical analysis and a winning attitude. By successfully incorporating the Elliott Wave Theory with Market Correlation, Cycles, Proprietary Pivot System, we provide precise forecasts with up-to-date analysis for 52 instruments including Forex majors & crosses, Commodities and a number of Equity Indices from around the World. Our clients also have immediate access to our proprietary Actionable Trade Setups, Market Overview, 1 Hour, 4 Hour, Daily & Weekly Wave Counts. Weekend Webinar, Live Screen Sharing Sessions, Daily Technical Videos, Elliott Wave Setup .
Copyright © 2017 ElliottWave-Forecast - All Rights Reserved Disclaimer: The above is a matter of opinion provided for general information purposes only and is not intended as investment advice. Information and analysis above are derived from sources and utilising methods believed to be reliable, but we cannot accept responsibility for any losses you may incur as a result of this analysis. Individuals should consult with their personal financial advisors.
© 2005-2022 http://www.MarketOracle.co.uk - The Market Oracle is a FREE Daily Financial Markets Analysis & Forecasting online publication.