The “Political Coup” Was Just Initiated In Washington D.C.!
Politics / US Politics May 18, 2017 - 04:57 PM GMTBy: Chris_Vermeulen
 The financial markets have already “priced in” huge tax cuts, reducing red tape regulations and a massive increase in infrastructure spending.
Perhaps, the markets are now believing that the agenda is not going to occur with Al Green asking for Trump impeachment? This could result in a significant downturn for stocks if it were to unfold.
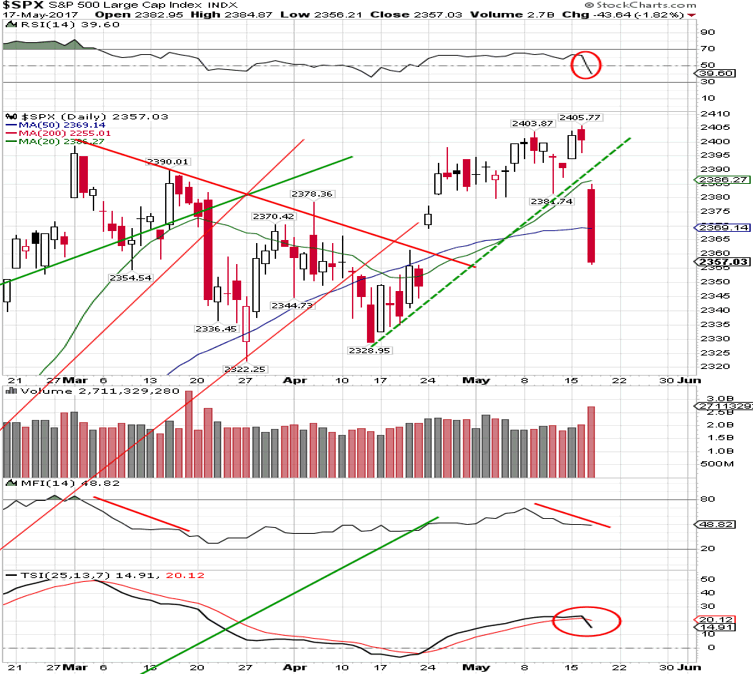
The SPX index declined more than 1.75% and wiped away about $375 billion in market value. The SPX went from a record close three days ago, to below its 50-day simple moving average on Wednesday May 17th, 2017. Institutional traders view the 50-day simple moving average as very strong trend support. The SPX level at 2407 turned out to be the best the bulls were capable to achieve. Their second attempt to push the benchmark higher failed at 2406, where the bears stepped in.
Financial Markets are Spooked!
There is a slow leak in U.S. stocks. The SPX has more declining stocks than advancing ones during this tight trading range. This is unusual behavior and resulted in lower returns over the following month. Tune in every morning for my video analysis and market forecasts on all ‘asset classes’ so you know where and why the market is about to move.
The SPX decline on Wednesday May 17th, 2017, was abnormally large, relative to the past 3 years.

These two market warning signs, the “Titanic Syndrome” and the “Hindenburg Omen” are giving a “preliminary sell signal” based on analyses of 52-week New Lows in relation to New Highs on the NYSE. On May 4th, 2017, the Hindenburg Omen was triggered on the NYSE and Nasdaq exchanges. It has a consistent record at highlighting underlying weak market conditions that preceded market trouble. On May 16th, 2017, both exchanges triggered the Titanic Syndrome. This occurs when the NYSE 52-week lows out-number 52-week highs within 7 days of an all-time high in equities within days of the major indexes closing at a one-year highs. Historically, these signals have led to further weakness over the following two weeks. As stocks were plunging, investors are currently panicking out of stocks and into the “safety” of bonds.
Is This The Return of New Volatility?
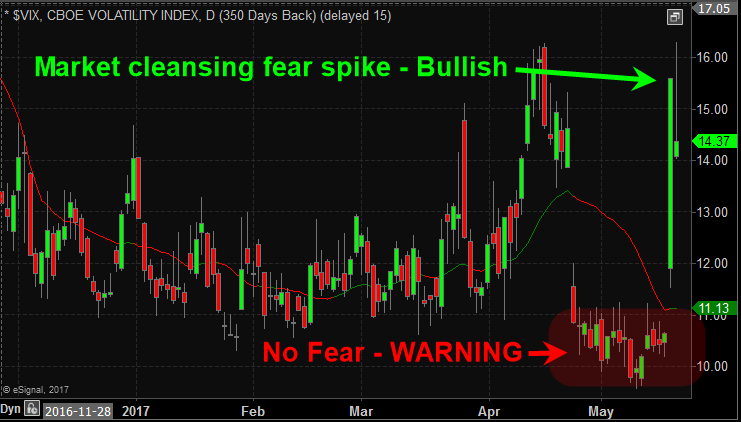
Richard Haworth, CIO of Capital Advisors, a London-based hedge fund, which bets on rising price swings is quoted as saying, “The market will revert to higher volatility and this could be the start of it. The sharp move this week reflects how low volatility the market was — how complacent.”

Conclusion:
In short, investors have been overly bullish with virtually no fear that share prices could fall. But this weeks drop seems to have renewed the fear and is cleansing the market by weak investor shares being sold to those who are bullish and willing to hold them for higher prices.
This is normal bullish price action and once this phase ends higher prices should return as we enter the summer months.
In the past week over at ATP service we have closed a few winning trades whie the market sold off. SLV 3.2% profit, FOLD 9.5%, MOBL 15%, and ERY 5.4%.
The bottom line is that it really does not matter which way the market goes, there will always be ways to profit.
Chris Vermeulen
www.TheGoldAndOilGuy.com – Daily Market Forecast Video & ETFs
www.ActiveTradingPartners.com – Stock & 3x ETFs
Chris Vermeulen is Founder of the popular trading site TheGoldAndOilGuy.com. There he shares his highly successful, low-risk trading method. For 7 years Chris has been a leader in teaching others to skillfully trade in gold, oil, and silver in both bull and bear markets. Subscribers to his service depend on Chris' uniquely consistent investment opportunities that carry exceptionally low risk and high return.
Disclaimer: Nothing in this report should be construed as a solicitation to buy or sell any securities mentioned. Technical Traders Ltd., its owners and the author of this report are not registered broker-dealers or financial advisors. Before investing in any securities, you should consult with your financial advisor and a registered broker-dealer. Never make an investment based solely on what you read in an online or printed report, including this report, especially if the investment involves a small, thinly-traded company that isn’t well known. Technical Traders Ltd. and the author of this report has been paid by Cardiff Energy Corp. In addition, the author owns shares of Cardiff Energy Corp. and would also benefit from volume and price appreciation of its stock. The information provided here within should not be construed as a financial analysis but rather as an advertisement. The author’s views and opinions regarding the companies featured in reports are his own views and are based on information that he has researched independently and has received, which the author assumes to be reliable. Technical Traders Ltd. and the author of this report do not guarantee the accuracy, completeness, or usefulness of any content of this report, nor its fitness for any particular purpose. Lastly, the author does not guarantee that any of the companies mentioned in the reports will perform as expected, and any comparisons made to other companies may not be valid or come into effect.
Chris Vermeulen Archive |
© 2005-2022 http://www.MarketOracle.co.uk - The Market Oracle is a FREE Daily Financial Markets Analysis & Forecasting online publication.


