


Gold is About to Shine Again!
Commodities / Gold and Silver 2017 May 12, 2017 - 08:30 AM GMTBy: Enda_Glynn

 My Bias: short in wave 3 blue.
Wave Structure: downward impulse wave 1, 2 blue
Long term wave count: lower in wave 3 blue
Important risk events: EUR: G7 Meetings, German Prelim GDP q/q, USD: G7 Meetings, Prelim UoM Consumer Sentiment, CPI m/m, Retail Sales m/m.
Hi everybody!
Hope your doing well.
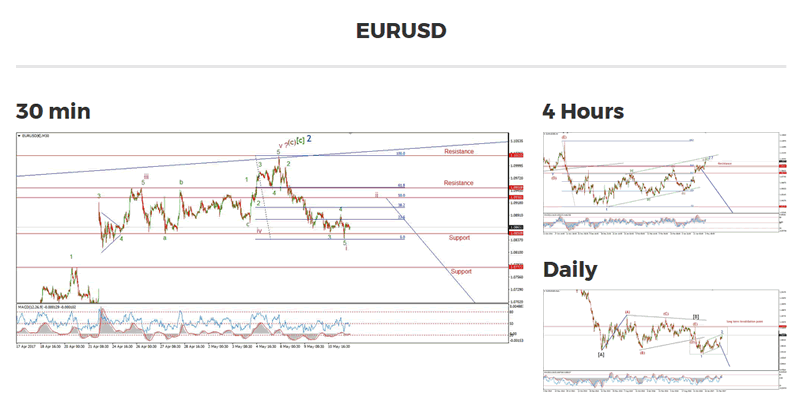
EURUSD had one more dip lower today as suggested last night.
If wave 'i' down is complete then we will get a counter trend rally into resistance at about 1.0950.
That is still the focus at the moment.
The rise off the wave 'i' low must be in three waves in order to create an elliott wave signal off the high.
That is five waves down and three waves up, creating a lower high and a short opportunity.
Todays low dipped below support at 1.0850 momentarily,
lets see if this rise develops into a three wave 'a,b,c' form.
My Bias: short below parity.
Wave Structure: continuing impulsive structure to the downside in wave (5)
Long term wave count: decline in wave (5) blue, below parity
Important risk events: GBP: G7 Meetings. USD: G7 Meetings, Prelim UoM Consumer Sentiment, CPI m/m, Retail Sales m/m.
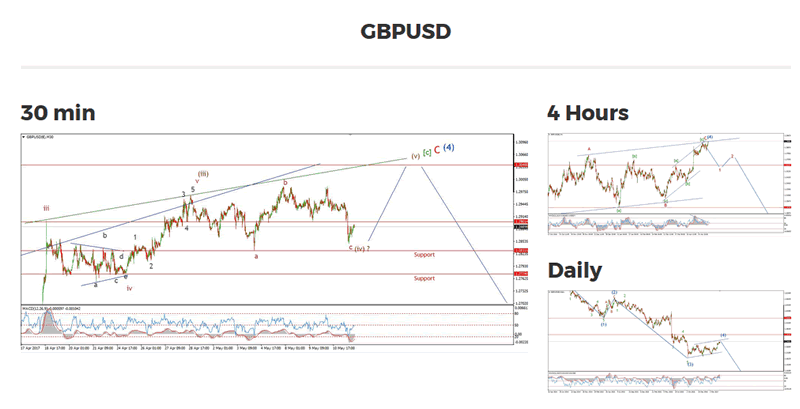
The decline off yesterdays high has ruled out the triangle idea at this point in time,
But the decline off the wave 'b' high at 1.2987 is in three waves so far,
This action continues to point to one last rally to close out the larger structure.
I have labelled todays low as wave (iv) brown,
This suggests a running flat correction in wave (iv) brown
I have marked the recent low at 1.2901, if the price rallies above this point it confirm the start of wave (v) brown
My Bias: LONG
Wave Structure: rally in wave [C]
Long term wave count: wave [C] is underway, upside to above 136.00
Important risk events: JPY: G7 Meetings. USD: G7 Meetings, Prelim UoM Consumer Sentiment, CPI m/m, Retail Sales m/m.
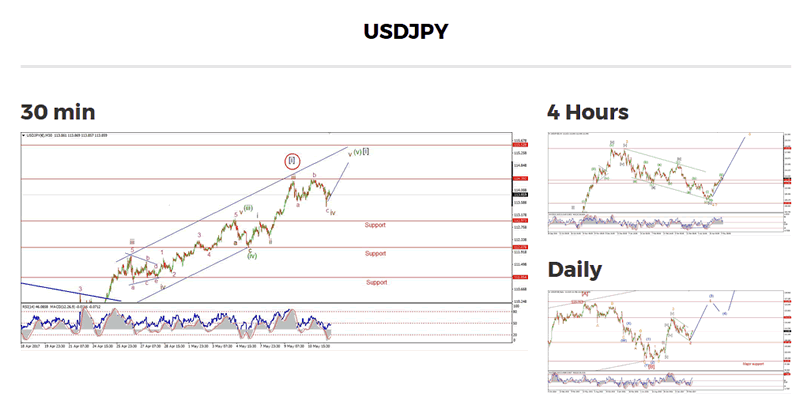
Prices declined in wave 'c' pink today,
the target was hit and the price has bounced again in an impulsive looking fashion.
Which again adds weight to the idea that wave 'iv' is an expanding flat.
Wave 'v' looks to have begun off todays low
The target for wave 'v' is at about 115.50.
A break of the wave 'b' high will signal that wave 'v' is underway.
Prices should not decline below 112.97, to keep the current short term count intact.
My Bias: market top is in.
Wave Structure: Impulsive 5 wave structure, possibly topping in an all time high.
Long term wave count: Topped in wave (5)
Important risk events: USD: G7 Meetings, Prelim UoM Consumer Sentiment, CPI m/m, Retail Sales m/m
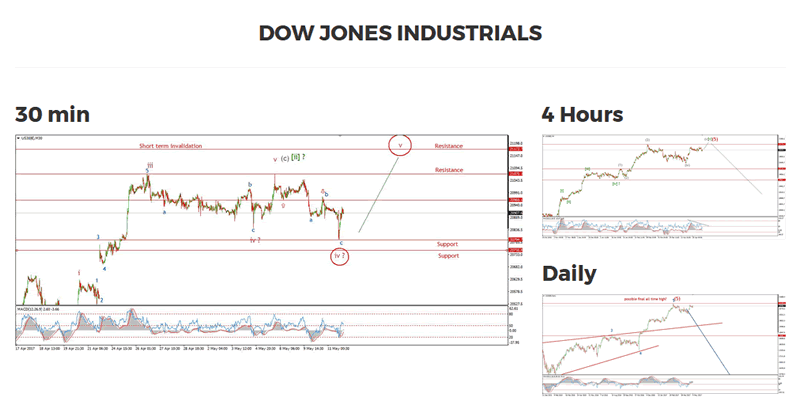
The DOW has again spiked lower and then retraced the losses,
This action points to an ongoing correction, as suggested in the alternate wave count on the 4hr chart.
This market is more likely going to break to a new all time high following todays action.
The decline off the recent high has an impulsive look to it,
But there is one major flaw,
The intermediate low and high, shown with arrows, have crossed.
this rules out the idea of an impulsive five waves down as the start of the new bear market.
It looks like we will have to wait for a few more weeks on that one.
So. where do we go from here;
If the price breaks 21000 again, I will switch to the alternate wave count
That count envisages one final high in wave 'v' pink.
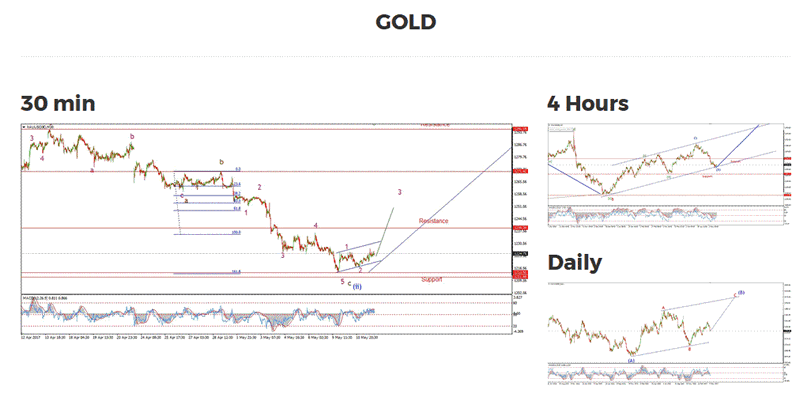
My Bias: Long towards 1550
Wave Structure: ZigZag correction to the upside.
Long term wave count: Topping in wave (B) at 1550
Important risk events: USD: G7 Meetings, Prelim UoM Consumer Sentiment, CPI m/m, Retail Sales m/m.
GOLD has again drifted sideways today.
I have shown a parallel trend channel around the price action.
If the price has bottomed at the recent low,
Then we should see the pattern break the upper trendline very soon.
The opposite is true for the lower trend line.
So if wave '3' pink arrives tomorrow that upper trendline will break at about 1231.
1239 is the first significant resistance to the developing rally in wave (iii) blue.
The technical situation has brightened somewhat over the last few days.
The 4hr RSI is on the verge of a buy signal, in the form of a centreline cross to the upside.
All the little signs are falling into place right now.
Gold is about to shine again!
Enda Glynn
http://bullwaves.org
I am an Elliott wave trader,
I have studied and traded using Elliott wave analysis as the backbone of my approach to markets for the last 10 years.
I take a top down approach to market analysis
starting at the daily time frame all the way down to the 30 minute time frame.
© 2017 Copyright Enda Glynn - All Rights Reserved
Disclaimer: The above is a matter of opinion provided for general information purposes only and is not intended as investment advice. Information and analysis above are derived from sources and utilising methods believed to be reliable, but we cannot accept responsibility for any losses you may incur as a result of this analysis. Individuals should consult with their personal financial advisors.
© 2005-2022 http://www.MarketOracle.co.uk - The Market Oracle is a FREE Daily Financial Markets Analysis & Forecasting online publication.