Poverty Is Going Extinct But The Middle Class Is Still In Trouble
Politics / Social Issues May 08, 2017 - 05:14 PM GMTBy: John_Mauldin
 On a global basis, the number of people trapped in extreme poverty has dropped this century. That trend does not mean everyone everywhere is living comfortably. Many millions still endure terrible conditions. But their numbers are shrinking.
The reason for the improvement, I believe, is two-fold. Technology and free trade. These have brought economic growth to formerly stagnant economies.
Here’s How Growth In Per Capita GDP Affects Extreme Poverty
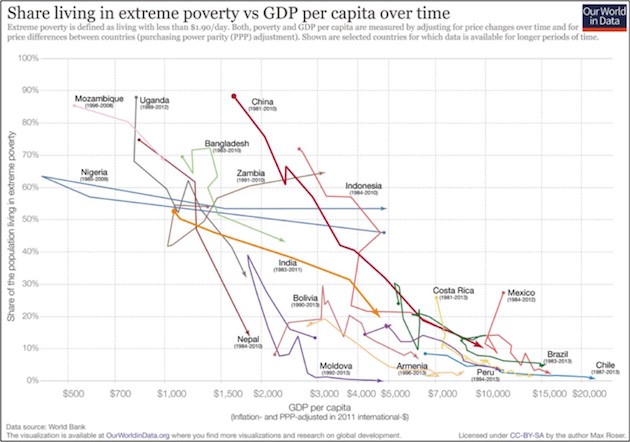
We can see this decline in extreme poverty in the following chart from Our World in Data. The chart plots the share of a country’s population living in extreme poverty vs. growth in per capita GDP. “Extreme poverty” means living on less than the equivalent of US$1.90 per day. The lines illustrate the change in that balance over time.
Source: Our World in Data
What we see here is that many countries began in the top left quadrant or close to it. There was a high percentage of the population in extreme poverty and with low GDP per capita. Over time, countries slide to the lower right. This means higher per capita GDP and fewer people living in extreme poverty.
So, it appears that a general increase in national income correlates with fewer people living in dire poverty. That is great news—something we should all celebrate.
We in the developed world can’t truly comprehend what extreme poverty is like. $1.90 a day? Americans spend more than that on coffee and junk food. I don’t know how people buy food, shelter, and everything else with such a small amount.
My point here is simple. If you are reading this, you are already far ahead of most human beings in terms of wealth, health, education, leisure time, and more.
The Middle Class Is Shrinking
Now let’s consider some related data from Europe and the US. In this case, we’ll look at the middle class.
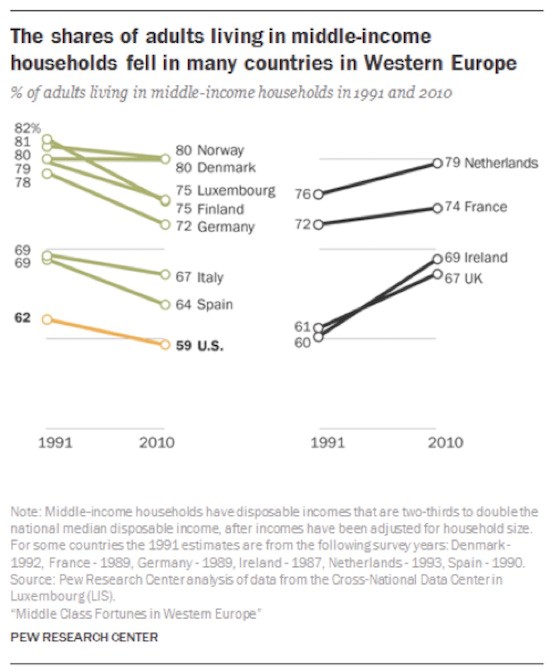
The Pew Research Center defines “middle class” as households with disposable incomes that range from two-thirds to twice the national median disposable income. In the US, that means a 2010 after-tax income between $35,294 and $105,881.
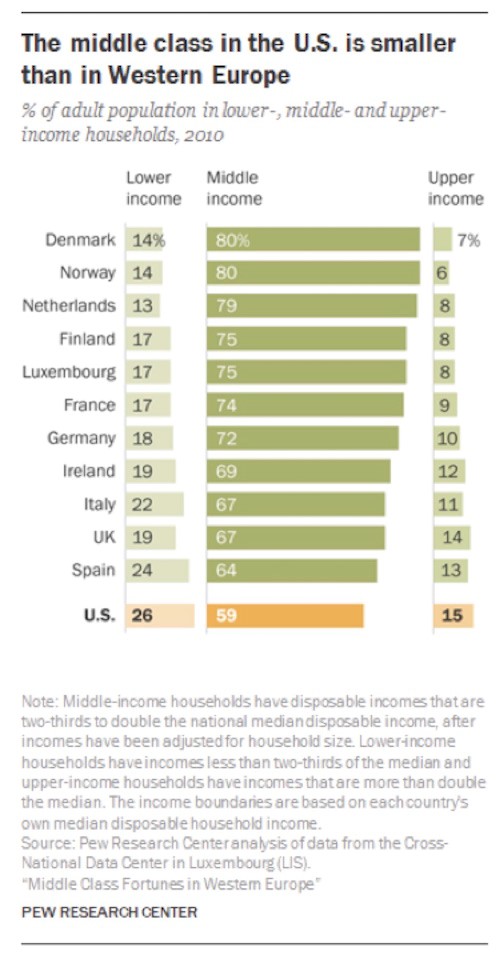
Pew found that from 1991 through 2010, the percentage of adults living in middle-class households in the US shrank from 62% to 59%.
Source: Pew Research Center
More significant, the US has the smallest percentage of middle-class adults of any of the advanced economies Pew studied. And note, during this period, the middle class expanded in the UK, Ireland, France, and the Netherlands.
The percentages themselves don’t tell us much. A shrinking middle class might be good if it means that more people are moving into the upper strata.
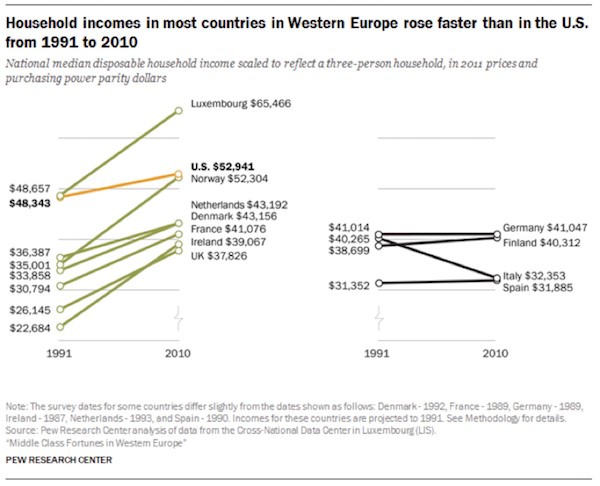
Now let’s look at a different data point. Namely, the median income that lies at the center of these distinctions.
The chart below shows how the median changed from the beginning to the end of the study period. US median household income rose from an inflation-adjusted $48,343 in 1991 to $52,941 in 2010. That is a 9.5% increase over 19 years.
That is pretty feeble, in my opinion. Indeed, that is lower than in some European countries.
Source: Pew Research Center
The US Middle Class Is Different From All Others
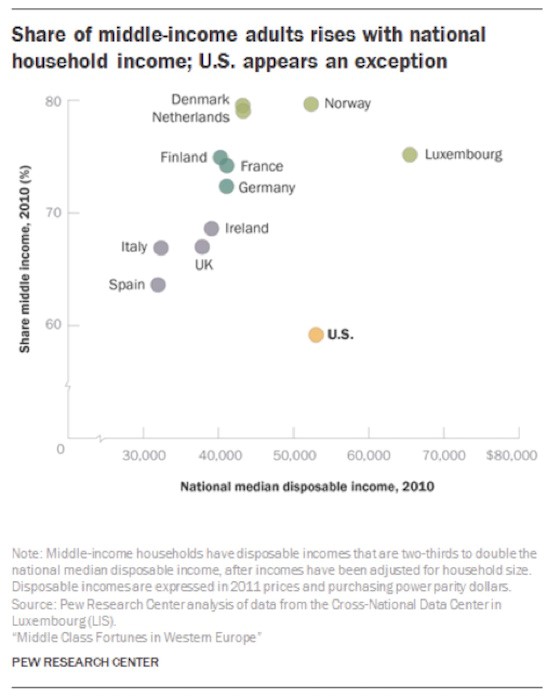
And the US middle class stands out in another way. Pew illustrates it with this scatterplot:
Source: Pew Research Center
Comparing the size of each country’s middle class with its median income, we see that the US is a distinct outlier. Our middle class is smaller than those of the middle classes in the other countries. And its income is higher.
Pew attributes the difference to another factor. The US has a larger percentage of people both above and below the middle class than any of the other countries studied.
Source: Pew Research Center
I don’t think these figures are a great mystery on the upper end. European countries have higher taxes. So they have relatively fewer wealthy people. Ditto on the lower-income end. It’s harder to be poor when your government has a generous welfare program.
But these differences at the top and bottom ends are greater than I would have expected.
Get a Bird’s-Eye View of the Economy with John Mauldin’s Thoughts from the Frontline
This wildly popular newsletter by celebrated economic commentator, John Mauldin, is a must-read for informed investors who want to go beyond the mainstream media hype and find out about the trends and traps to watch out for. Join hundreds of thousands of fans worldwide, as John uncovers macroeconomic truths in Thoughts from the Frontline. Get it free in your inbox every Monday.
John Mauldin Archive |
© 2005-2022 http://www.MarketOracle.co.uk - The Market Oracle is a FREE Daily Financial Markets Analysis & Forecasting online publication.


