


This is the Bottom in The Gold Miners - GDX and GDXJ
Commodities / Gold & Silver Stocks 2017 Apr 27, 2017 - 02:17 PM GMTBy: Submissions

 Zach writes: This is the bottom in gold mining ETFs GDX and GDXJ. How can I say that so confidently, I hear you ask?
The charts are talking to us...Here goes...
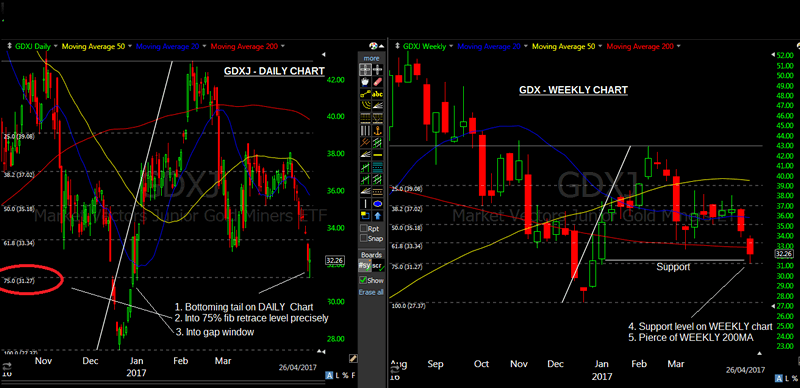
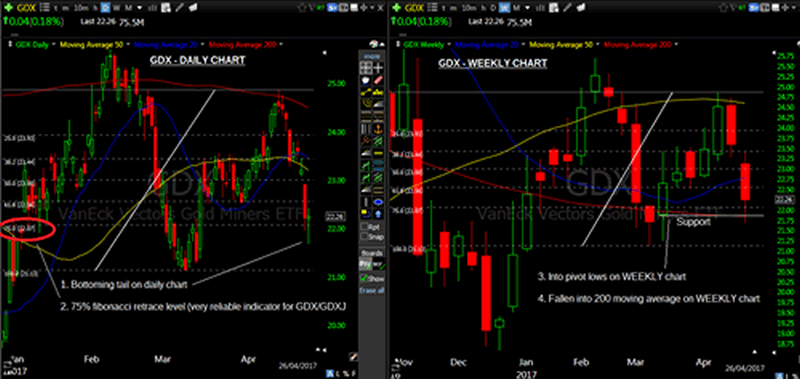
1. We are seeing bottoming tails on the Daily chart of both GDX and GDXJ, which indicates a bottom - in conjunction with other factors.
2. We are into 75% fib levels, which are very reliable levels of support in the case of the gold miners.
3. We are into major pivot support on the WEEKLY time frames, and also the WEEKLY 200MA on both GDX and GDXJ.
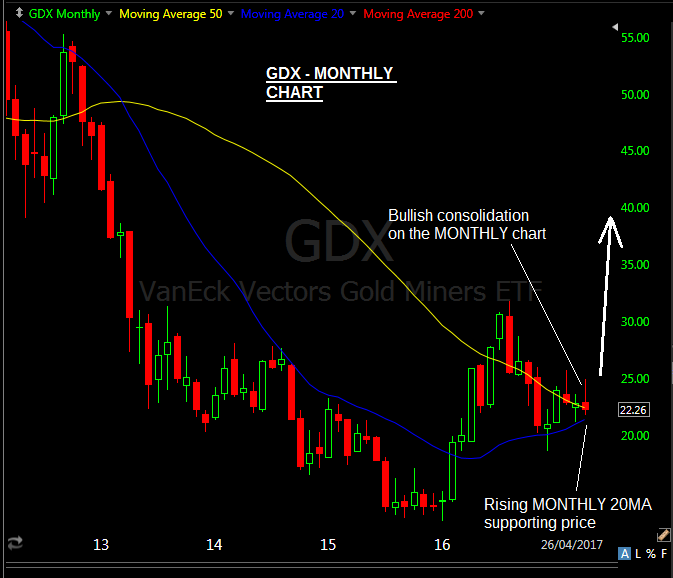
4. The MONTHLY time frames (which are rarely considered - but are very important) are showing we are making bullish consolidation on both GDX and GDXJ
See the charts below.
How big will the bounce be?
More than likely back up to the highs of April, and possibly beyond given further consolidation of price at those higher levels.
When will the bounce begin?
Price may linger around here for a few days at these lows, but should head north within a couple of weeks. This analysis will be reinforced further if we get a bottoming tail on the WEEKLY charts, particularly in GDXJ. That will only be known on Friday of this week or next, when the weekly candles complete.
What is most interesting to note is that the gold price has barely come back down in price while the gold miners have taken a beating in the last 2 weeks. GLD is still lingering at the highs, and has merely had a very mild pullback into a strong level of support. Conventional wisdom says the gold miners will lead gold, but I don't subscribe to that ideal. In December 2015 GLD bottomed in mid December, while the gold miners continued to make new lows, bottoming only a whole month later, after which followed a monster rally which proves the point.
Once technical analysis has been mastered, you'll notice that it is very much the charts which determine which way a stock or ETF will move, particularly on high volume ETFs like GDX/GDXJ. Many a time I've witnessed it's the charts that will tell you how something will react to the Fed or other news item, and not the other way around.
Disclosure: I am long GSS through Call Options which I acquired in February of this year. At the time of writing I have no positions in GDX or GDXJ, however, over the next few days I intend to go long GDX or GDXJ through buying options on their leveraged cousins NUGT/JNUG as well as alert subscribers to my site.
Zach
© 2017 Copyright tradingwithzach - All Rights Reserved
Disclaimer: The above is a matter of opinion provided for general information purposes only and is not intended as investment advice. Information and analysis above are derived from sources and utilising methods believed to be reliable, but we cannot accept responsibility for any losses you may incur as a result of this analysis. Individuals should consult with their personal financial advisors.
© 2005-2022 http://www.MarketOracle.co.uk - The Market Oracle is a FREE Daily Financial Markets Analysis & Forecasting online publication.