US Recession Imminent? Both the Leading Economic Indicators and the KRWI are Flashing Warning Signs
Economics / US Economy Mar 22, 2007 - 10:32 PM GMTBy: Paul_L_Kasriel
Today the Conference Board reported that its index of Leading Economic Indicators (LEI) for February declined by 0.5% on the heel's of January's downwardly revised 0.3% drop. The January-February LEI average is down 0.49% from its Q1:2006 average. If the January and February levels of the LEI are not changed after revisions, then in order for the first quarter's LEI average to equal that of Q1:2006, the March LEI would have to increase 1.7%.
The last time the month-to-month increase in the LEI even approached this magnitude was back in March 2004, when it increased 1.4%. So, as of right now, the odds favor the first quarterly average year-over-year contraction in the LEI of this current economic expansion.
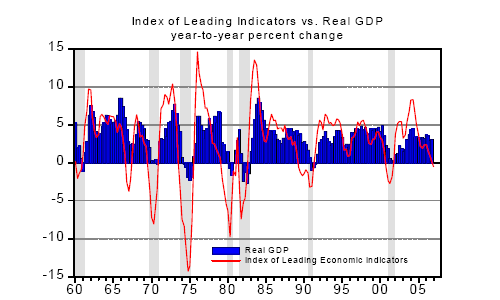
If, in fact, we are about to witness a year-over-year decline in the quarterly average of the LEI, would that be a big deal, cyclically speaking. History shouts, "YES!" Chart 1 shows that a year-over-year contraction in the quarterly average LEI has heralded every recession (vertically shaded areas) since that of 1960, yielding only one false signal. That false signal occurred in late 1966 through early 1967. Back then, this period of economic turbulence was called the "mini-recession of 1967." An official recession was never named for this period but the pace of economic activity did slow. Real GDP just did not contract - perhaps because of series Fed rate cuts commencing early in 1967.
Notice also in Chart 1 that after the first quarter the year-over-year change in the LEI is negative, successive quarters also are negative . In other words, the LEI has not given any "head-fakes" after it first signals a recession.
Chart 1

The LEI might be termed the ultimate Rodney Dangerfield of economic statistics - it can't get no respect. The LEI often is referred to derisively by mainstream Wall Street economists as the index of Misleading Indicators. I suppose that if there were an indicator that gave consistently better advance warnings of the onset of recessions and recoveries than one's my "proprietary" GDP forecasting model, I would not look kindly on this indicator either for fear of having my forecasting job replaced by a Conference Board press release. And although I might publicly deride the LEI, I would privately incorporate it into my forecasts. Judging from how poorly consensus economic forecasts consistently fail to anticipate cyclical turning points, it looks as though many macroeconomic forecasters are either ignorant of how well the LEI outperforms them or are just plain stupid.
What is most amazing, though, is that evidently the chief economic forecaster for the Conference Board, the very organization that calculates and publishes the LEI, seems to be currently ignoring the very strong cyclical message being sent by the recent behavior of the LEI. To wit, the Conference Board's 2007 real GDP growth forecast submitted for the March Blue Chip Survey was 2.9% -- considerably above the average forecast of the 50 survey respondents of 2.5% and the second highest of the forecasts, with 3.0% taking "top honors."
But it looks as though one forecaster may be paying more attention to the LEI than he used to. FOMC transcripts show that then Fed Chairman Alan Greenspan failed in August 1990 to realize that a recession already was underway and in October 2000 that a recession was imminent even though the behavior of the LEI clearly was signaling as much. But perhaps Greenspan's recent 30% probability forecast of a 2007 recession is based on a new appreciation of the LEI.
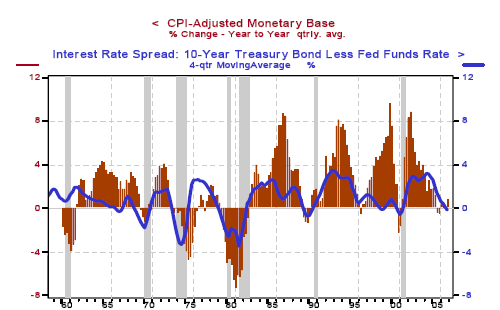
To corroborate the recession-warning signal being sent by the LEI, I have developed another recession-warning indicator. I have found that every recession starting with the 1970 recession has been immediately preceded by the following combination - a negative spread between the yield on the Treasury 10-year security and the federal funds rate (hereafter referred to as "the spread) on a four-quarter moving average basis and a year-over-year contraction in the quarterly average of the CPI-adjusted monetary base. The monetary base is the sum of bank reserves and coin/currency, both of which have been created out of thin air, as it were, by the Fed. Chart 2 shows the historical behavior of the "Kasriel Recession-Warning Indicator" (KRWI). For the theoretical underpinnings of the KRWI, see " The Inverted Yield Curve - Is It Really Different This Time? " The Econtrarian, March 16, 2007.
Chart 2

The KRWI has given no false signals in that when it has warned of a recession, there has been one. Unlike the LEI, which signaled a recession for 1967, the KRWI did not. However the 1960 recession was not signaled by the KRWI because the spread remained positive, although it did narrow. As of the fourth quarter of last year, the spread moved into negative territory, but the year-over-year change in the real monetary base remained positive. So, like the LEI, as of the fourth quarter of last year, the KRWI had not signaled that a recession was imminent.
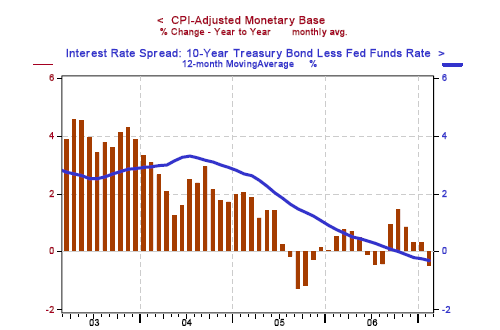
But how is the KRWI shaping up in the current quarter? About the same as the LEI. The KRWI in terms of monthly data is shown in Chart 3. Barring some miraculous change between now and the end of this month, the spread component of the KRWI will be deeper into negative territory. In February, the year-over-year change in the real monetary base turned negative by about 50 basis points.
The January-February average of the real monetary base is barely above its quarterly average of Q1:2006. Again barring revisions to January/February data, the March 2007 real monetary base would have to increase by about 0.2% over that of its March 2006 level in order for the year-over-year change in the real monetary base to remain in positive territory in the first quarter of this year and thus not trigger an imminent recession warning by the KRWI. If the year-over-year increase in the March CPI were to stay at its February reading of 2.4%, this would require a year-over-year increase in the March nominal monetary base of 2.6% in order to get a positive year-over-year change in the real monetary base. In the first two weeks of March, the year-over-year increase in the nominal monetary base is just 1.9%.
Chart 3

In sum, barring upward revisions in the LEI and KRWI and sharp increases in the immediate months ahead, both of these indicators will be sending a signal that a recession is on the horizon. Perhaps this will be the first time in over 45 years that the KRWI will emit a false signal and only the second time that the LEI emits a false signal. Perhaps.
*Paul Kasriel is the recipient of the 2006 Lawrence R. Klein Award for Blue Chip Forecasting Accuracy
By Paul Kasriel
The Northern Trust Company
Economic Research Department - Daily Global Commentary
Paul joined the economic research unit of The Northern Trust Company in 1986 as Vice President and Economist, being named Senior Vice President and Director of Economic Research in 2000. His economic and interest rate forecasts are used both internally and by clients. The accuracy of the Economic Research Department's forecasts has consistently been highly-ranked in the Blue Chip survey of about 50 forecasters over the years. To that point, Paul received the prestigious 2006 Lawrence R. Klein Award for having the most accurate economic forecast among the Blue Chip survey participants for the years 2002 through 2005.
The opinions expressed herein are those of the author and do not necessarily represent the views of The Northern Trust Company. The Northern Trust Company does not warrant the accuracy or completeness of information contained herein, such information is subject to change and is not intended to influence your investment decisions.
© 2005-2022 http://www.MarketOracle.co.uk - The Market Oracle is a FREE Daily Financial Markets Analysis & Forecasting online publication.


