


What's Next for Crude Oil Stocks?
Commodities / Oil Companies Apr 04, 2017 - 01:44 PM GMTBy: Nadia_Simmons

 Without a doubt, the previous week was the best week of 2017 for oil bulls. In that time, the black gold gained 5.48% and invalidated the earlier breakdown under the psychologically important barrier of $50. What happened at the same time with oil stocks? What's next for the XOI? Let's jump right into charts (chart courtesy of http://stockcharts.com) and find out what can we infer from them about future moves.
Let's start today's article with the long-term chart of oil stocks.
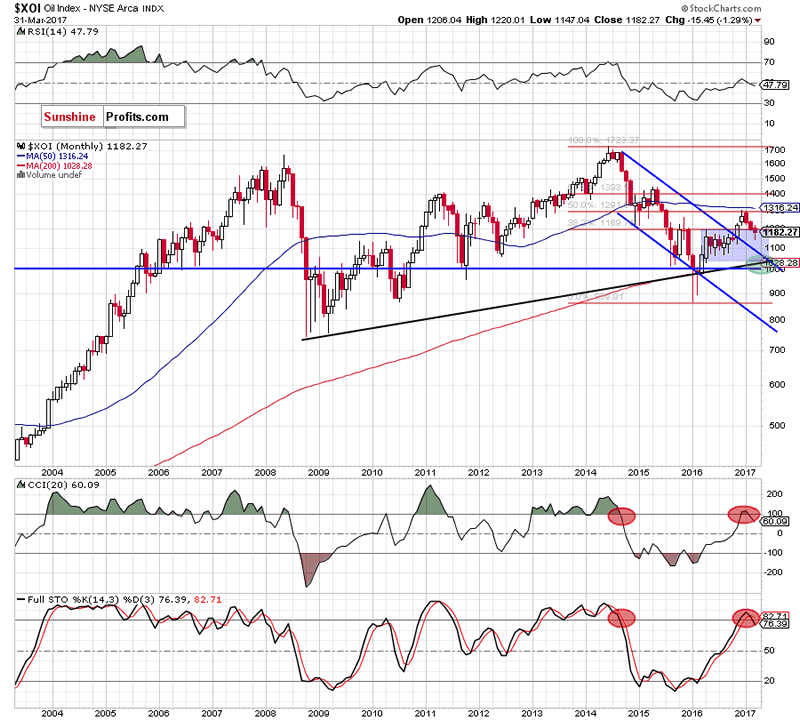
On the long-term chart, we see that oil stocks moved lower in the previous month, which resulted in a drop below the previously-broken upper border of the clue consolidation. This is a negative development, which suggests further deterioration - especially when we factor in the sell signals generated by the CCI and the Stochastic Oscillator.
How did this drop affect the medium-term picture? Let's check.

From this perspective, we see that the last month's decline took the XOI below the April 2016 high and the previously-broken red zone, which serves now as resistance. This suggests that as long as there is no breakout (and a weekly closure) above this area further improvement is questionable.
Will we see another increase in the coming month? Let's examine the daily chart and look for more clues about future moves.
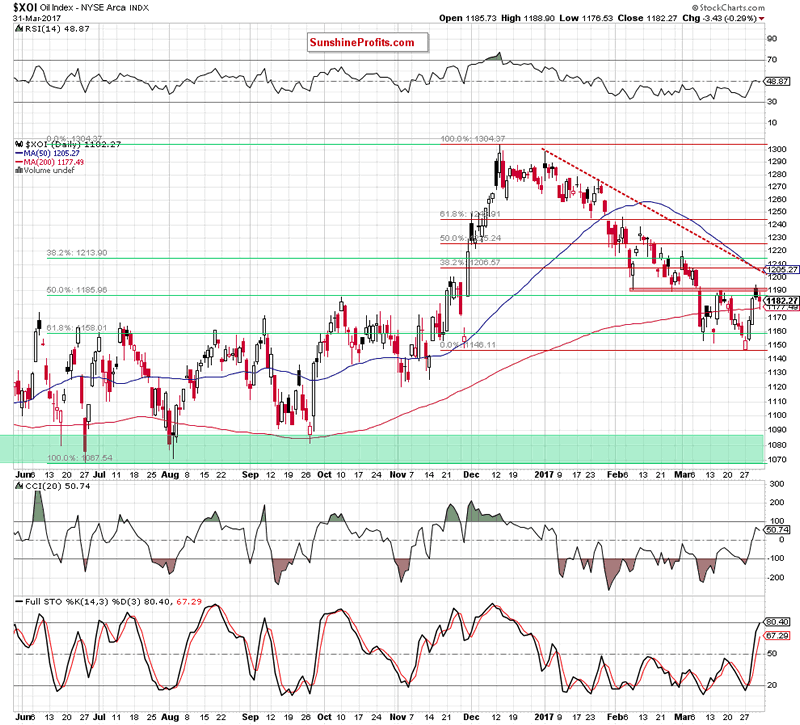
On the daily chart, we see that oil stocks rebounded in the previous week, which resulted in a climb to the red resistance zone based on the February lows. As you see, this area stopped oil bulls in two times in March, which suggests that may see a similar price action in the coming days. Nevertheless, even if the XOI moves a bit higher, the space for increases seems limited as quite close from current levels we can notice the 38.2% Fibonacci retracement based on the entire December - March downward move and the red declining dashed line based on the January highs, which together could encourage oil bears to act.
If this is the case, we'll see a re-test of the 61.8% Fibonacci retracement and the recent lows in the coming days. If this area is broken, the next downside target will be around 1,120-1,125, (the November lows) or even around 1,067-1,100, where the next psychologically important barrier, the June, July, September 2016 lows and the 50% Fibonacci retracement are. It is also worth noting that this support area is currently also reinforced by the previously-broken upper border of the blue declining trend channel seen on the monthly chart.
Summing up, the outlook for oil stocks is currently bearish as the XOI invalidated the earlier breakout above the upper border of the blue consolidation (seen on the monthly chart) and the red resistance zone (marked on the weekly chart), which suggests another attempt to move lower and a test of the recent lows in the coming days.
Thank you.
If you would like to know more about oil market and our interesting ratios, we encourage you to sign up for Oil Investment Update, Oil Trading Alerts or the All-Inclusive Package that includes them.
Nadia Simmons
Forex & Oil Trading Strategist
Sunshine Profits: Gold & Silver, Forex, Bitcoin, Crude Oil & Stocks
Stay updated: sign up for our free mailing list today
* * * * *
Disclaimer
All essays, research and information found above represent analyses and opinions of Nadia Simmons and Sunshine Profits' associates only. As such, it may prove wrong and be a subject to change without notice. Opinions and analyses were based on data available to authors of respective essays at the time of writing. Although the information provided above is based on careful research and sources that are believed to be accurate, Nadia Simmons and his associates do not guarantee the accuracy or thoroughness of the data or information reported. The opinions published above are neither an offer nor a recommendation to purchase or sell any securities. Nadia Simmons is not a Registered Securities Advisor. By reading Nadia Simmons’ reports you fully agree that he will not be held responsible or liable for any decisions you make regarding any information provided in these reports. Investing, trading and speculation in any financial markets may involve high risk of loss. Nadia Simmons, Sunshine Profits' employees and affiliates as well as members of their families may have a short or long position in any securities, including those mentioned in any of the reports or essays, and may make additional purchases and/or sales of those securities without notice.
© 2005-2022 http://www.MarketOracle.co.uk - The Market Oracle is a FREE Daily Financial Markets Analysis & Forecasting online publication.