Critical Fibonacci Extensions May Mark End Of Trump Stock Market Rally
Stock-Markets / Stock Market 2017 Mar 29, 2017 - 05:18 PM GMTBy: Chris_Vermeulen
 Our research is showing critical Fibonacci extensions are in place for US Major Markets that may be foretelling of a massive market correction. Part of our research is to search for and study events and resources that are a bit abstract. One component of this research is to identify critical price levels and early warning triggers from abstract price data. The major US indexes and most individual all showing price advanced over the past years and many are showing extended price rallies since the US Presidential election on November 8, 2017. Yet, none are as foretelling as our “US Custom Index”.
The INDU is showing a price advance equal to a 1.8765 Fibonacci expansion.
The SPX500 is showing a price advance equal to a 1.9165% Fibonacci expansion.
What is the relevance of these expansions? Many Fibonacci retracements and expansions fail near a n.875 ~ n.9231. Now, you may be asking, “why should I be concerned about failure at these levels?”. The answer is simple, one of the most important components of Fibonacci analysis is an abstract theory regarding “Failure to Succeed or Failure to Fail”. Another very important component of Fibonacci theory is that “price is always attempting to establish new highs or lows”. How this relates to our understand of what to expect in the future depends on expectations that are presented by understanding Fibonacci ratios, price projections and simple key components of the Fibonacci theory.
Without going into too much detail, “Failure to Succeed” is the failure to match or meet expected price objectives or actions. “Failure to Fail” is the ability of price/trends to exceed expectations or objectives and extend beyond expected target levels. Again, price is always attempting to establish new highs or lows within Fibonacci theory. Therefore, success or failure at critical levels means price should attempt to either reverse or extend.
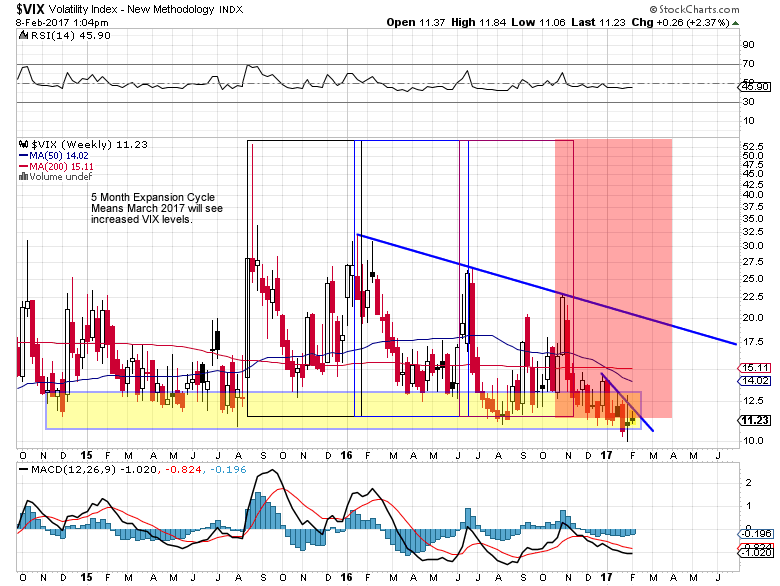
As you are probably well aware, we have been expecting an increase in the VIX to coincide with extensive major market volatility between March 15th and April 24th. So far, the VIX has jumped form the March 15th low over 41%. You can read more about this by reviewing THE VIX ARTICLE. Our analysis, originated in late January, and warns of an extreme potential for massive price movements across the globe. This all depends of a number of factors correlating to prompt these expected swings, but so far, everything we predicted is starting to happen.
VIX Chart

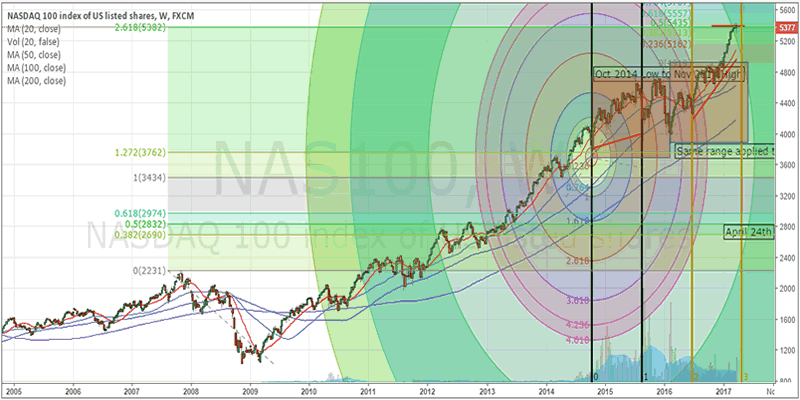
This next chart of the NAS100 Index shows a number of key components at play. First, the 2.618% Fibonacci expansion level is currently providing strong resistance. Additionally, it shows a series of price cycle bottoms that originate from 2014 & 2015 price lows. Lastly, it shows current price highs are also lining up on a 1.50% Fibonacci Expansion from the recent price rotation illustrated by the last red rectangle on the chart. One should pay attention that the two red rectangles are copies of one another and illustrate that price rotation has been in nearly identical volatility ranges since the end of 2014. Only after the US Presidential election was price able to breakout of these ranges and extend to current levels.
Further, the arcing analysis on the chart represents Fibonacci vibrational price analysis. It is designed to show us where and when price may break out of or into new trends/channels. As you can see, the arcs align relatively well with price activity and price has recently extended beyond the most recent arc level on the right edge of the chart.
Combine all of this analysis into a simple message, one would likely resolve the following : Current Fibonacci price extensions are providing clear resistance. Price cycles state we should establish a new price low near April 24th and price has recently extended beyond a vibrational cycle that coincides with Fibonacci resistance. Historical price ranges show us that June 5th, 2017 may begin a new price trend cycle
NAS100 Chart
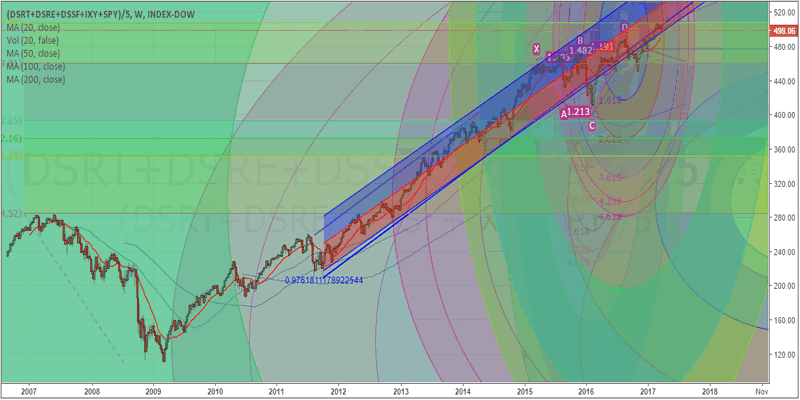
The “key” in terms of our analysis and understanding of the current market setup is seen on our US Custom Index. This custom index is made up of key components of the US Economy (US Retail, Real Estate, Consumer Finance, Consumer Discretionary and the SPY). The reason we have selected these for our index is we believe they relate a broad scope of “early movers” as related to the overall health of the US economy. In other words, this custom index should relate early strength or weakness in the relation to general US economic activities rather well.
This chart is showing a number of key components, but most important is the YELLOW line near the top which represents a near EXACT 1.272% expansion of price from recent highs set in 2007 (2.272 % expansions from the lows in 2009). The n.272 Fibonacci expansion levels, like most other Fibonacci expansion levels prompt one of two possible outcomes; a. Price congestion followed by further advance, or b. a moderately deep price retracement (often greater than 25% of the recent move).
This chart, as we stated earlier, is the “key to understand the potential of and expectations of all of this analysis. With the VIX expected to “spike” between now and April 24th, the NAS100 chart showing massive expansion (2.618) that is correlating with recent 1.50% resistance and key vibrational resistance and, this Custom Index, pivoting off of critical 1.272% Fib Expansion, near the beginning of our expected VIX expansion, near Fibonacci Vibrational levels on April 10th and near the lower range of a multi-year historical Standard Deviation channel, we are preparing for an immediate potential price rotation (correlating with a spike in the VIX) that may drive equity prices down to near 2016 lows (a drop of potentially 15~20%).
Custom Index Chart
Our analysis is showing that many key elements of cross market analysis are aligning to warn that we may see a moderate term end to the “Trump rally” and a relatively deep retracement that could shake the markets. We are not predicting a 2009 style crash. We are, although, expecting healthy market rotation that will setup additional opportunities for traders to identify profitable trades.
At this point in time, we wanted all of our readers to be aware of the multiple correlations that support our analysis and the fact that volatility is set to start rising. Keeping this in mind, we are positioning ourselves and our clients to take advantage of these expected moves and we will continue to monitor the markets price action to take advantage of opportunities as they form. If you want know more of our unique Momentum Reversal Method (MRM) and our trade setups, please visit www.ActiveTradingPartners.com to learn more.
Chris Vermeulen
Chris Vermeulen is Founder of the popular trading site TheGoldAndOilGuy.com. There he shares his highly successful, low-risk trading method. For 7 years Chris has been a leader in teaching others to skillfully trade in gold, oil, and silver in both bull and bear markets. Subscribers to his service depend on Chris' uniquely consistent investment opportunities that carry exceptionally low risk and high return.
Disclaimer: Nothing in this report should be construed as a solicitation to buy or sell any securities mentioned. Technical Traders Ltd., its owners and the author of this report are not registered broker-dealers or financial advisors. Before investing in any securities, you should consult with your financial advisor and a registered broker-dealer. Never make an investment based solely on what you read in an online or printed report, including this report, especially if the investment involves a small, thinly-traded company that isn’t well known. Technical Traders Ltd. and the author of this report has been paid by Cardiff Energy Corp. In addition, the author owns shares of Cardiff Energy Corp. and would also benefit from volume and price appreciation of its stock. The information provided here within should not be construed as a financial analysis but rather as an advertisement. The author’s views and opinions regarding the companies featured in reports are his own views and are based on information that he has researched independently and has received, which the author assumes to be reliable. Technical Traders Ltd. and the author of this report do not guarantee the accuracy, completeness, or usefulness of any content of this report, nor its fitness for any particular purpose. Lastly, the author does not guarantee that any of the companies mentioned in the reports will perform as expected, and any comparisons made to other companies may not be valid or come into effect.
Chris Vermeulen Archive |
© 2005-2022 http://www.MarketOracle.co.uk - The Market Oracle is a FREE Daily Financial Markets Analysis & Forecasting online publication.


