Stock Market VIX Cycles Set To Explode March/April 2017 – Part II
Stock-Markets / Stock Market 2017 Mar 23, 2017 - 06:55 PM GMTBy: Chris_Vermeulen
 Back in early February 2017, we posted an article to all our members about how our analysis showed a very strong potential for larger price swings with the potential for a massive explosion in the VIX indicator based on a price cycle pattern we had been studying. Many of you may remember this article, if not Click Here to review the original.
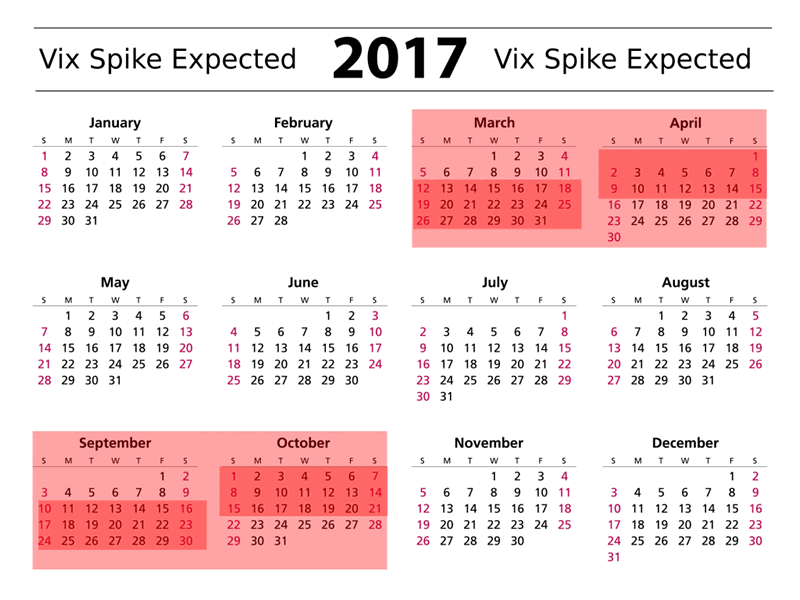
As of right now, only 10 days into our proposed “VIX Spike Window” (from March 12th to April 15th), we thought it would be a good idea to review some of our analysis before we enter the heart of the VIX expansion window (March 25th to April 8th).
Vix Spike Calendar

As you may recall, we expect a, roughly, five month cycle of expanding VIX volatility to continue within the time-frames mentioned above. The peak of this volatility will likely happen between March 25th and April 8th – what we are calling the “heart of the window”. This will likely be a very tumultuous and volatile period where massive rotations in price could occur. Additionally, new or reversal trends would also be key components of this type of expanded volatility. This means active traders have an opportunity to generate some fantastic returns from these moves.
Based on my original analysis from early February, lets summarize how things are expected to play out over the next few weeks for a few key symbols.

As you review our earlier analysis, pay attention to the details we laid out for each symbol. We expected “key top” levels to be reached at the time of the original article followed by price rotation/retracements, followed by more price trending. Pay special attention to the details we discussed for each of these symbols in the first article.
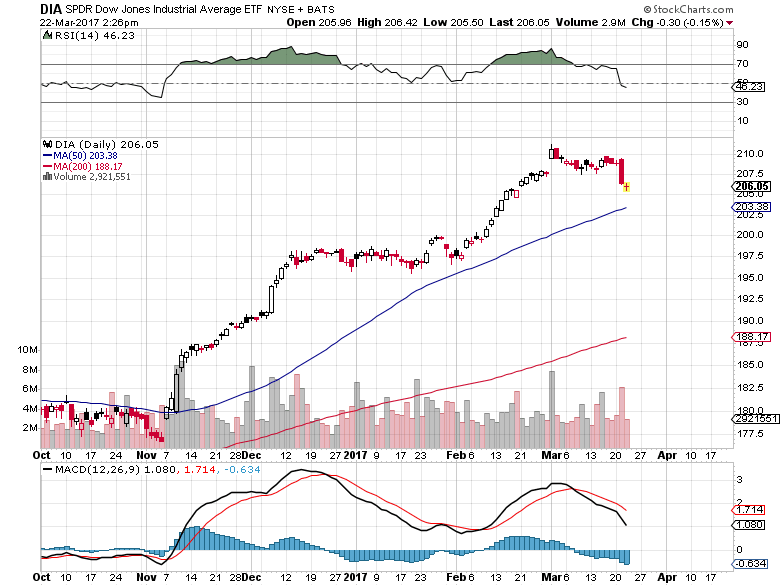
DIA pulled back near 6% (Min Volatility target reached) from recent highs and we are expecting more volatility before any future moves
QQQ pulled back 2.6% and we are expecting a deeper pullback as the volatility explodes in the near future.
XOI has fallen an additional 4.33% and we are expecting this move to continue to near $1075 (an additional -$81.50) before attempting to find a bottom.
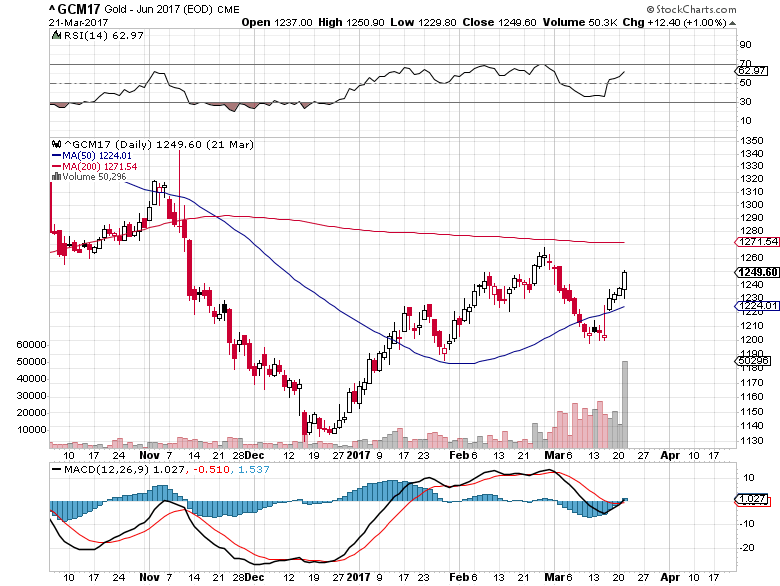
GOLD retraced just over 5% from near $1265 and is currently in a solid uptrend. Our current projection is for a move above $1310, followed by a pullback below $1280 (where we want to try to buy), followed by further upside moves to above $1350.
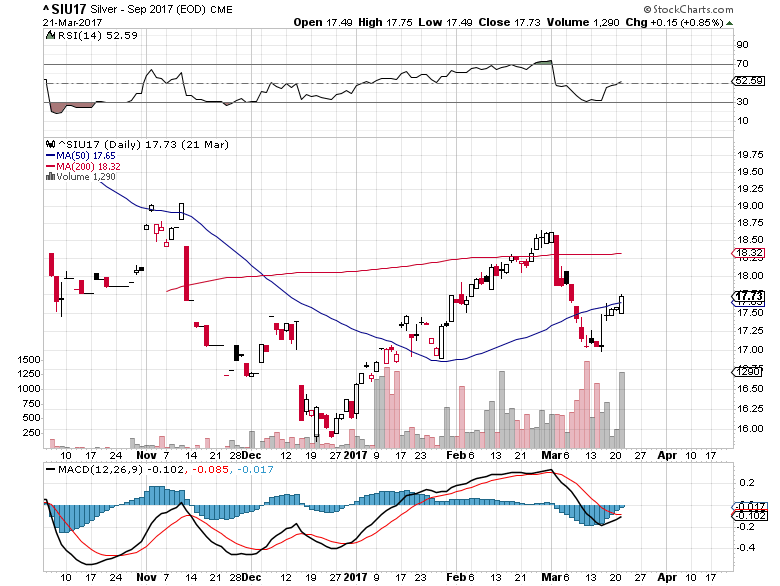
SILVER has retraced nearly 9% (Min Volatility Target Reached) from recent highs and is setting up potential move back above $18.00 or higher.
DIA Chart

Gold Chart

Silver Chart

At this point, we should be very cautious to consider only highly probable trading signals because the expected volatility in the global markets should become more violent and unpredictable. This makes for great short term Momentum Reversal trades though.
Our recent Momentum Reversal Trades have shown fantastic results like UGAZ 74% and NUGT 112%. The possibility of seeing exploding volatility over the next few weeks in combination with massive potential rotation in prices will allow us to find some incredible opportunities for followers of our work and trades.
Remember, the Heart of the volatility window should be from March 25, 2017 to April 8, 2017. You can take advantage of this by follow us at: www.ActiveTradingPartners.com
Chris Vermeulen
Chris Vermeulen is Founder of the popular trading site TheGoldAndOilGuy.com. There he shares his highly successful, low-risk trading method. For 7 years Chris has been a leader in teaching others to skillfully trade in gold, oil, and silver in both bull and bear markets. Subscribers to his service depend on Chris' uniquely consistent investment opportunities that carry exceptionally low risk and high return.
Disclaimer: Nothing in this report should be construed as a solicitation to buy or sell any securities mentioned. Technical Traders Ltd., its owners and the author of this report are not registered broker-dealers or financial advisors. Before investing in any securities, you should consult with your financial advisor and a registered broker-dealer. Never make an investment based solely on what you read in an online or printed report, including this report, especially if the investment involves a small, thinly-traded company that isn’t well known. Technical Traders Ltd. and the author of this report has been paid by Cardiff Energy Corp. In addition, the author owns shares of Cardiff Energy Corp. and would also benefit from volume and price appreciation of its stock. The information provided here within should not be construed as a financial analysis but rather as an advertisement. The author’s views and opinions regarding the companies featured in reports are his own views and are based on information that he has researched independently and has received, which the author assumes to be reliable. Technical Traders Ltd. and the author of this report do not guarantee the accuracy, completeness, or usefulness of any content of this report, nor its fitness for any particular purpose. Lastly, the author does not guarantee that any of the companies mentioned in the reports will perform as expected, and any comparisons made to other companies may not be valid or come into effect.
Chris Vermeulen Archive |
© 2005-2022 http://www.MarketOracle.co.uk - The Market Oracle is a FREE Daily Financial Markets Analysis & Forecasting online publication.


