


Stock Market Charts That Scream “This Is It” - Here’s What to Do
Stock-Markets / Stock Market 2017 Mar 22, 2017 - 10:53 AM GMTBy: David_Galland

 By Stephen McBride: The S&P 500 and DJIA haven’t seen a 1% drop since October 2016. For some perspective, Hillary Clinton was the presidential frontrunner the last time markets fell 1%. This is the longest such streak for both indices in over 20 years.
In February, the DJIA recorded its longest “winning streak” since 1987. It closed 2,000 points above its 200-day moving average for the first time ever.
Also in February, the combined market cap of the S&P 500 topped $20 trillion for the first time. Its market cap has increased by over $2 trillion since the election—staggering.
Like we discussed last month, with a proliferation of “record” highs in 2017, where are market valuations at today? The five charts below paint the whole picture best.
Chart #1: S&P 500 Price/EBITDA
Today, the S&P 500 price/EBITDA sits at an all-time high.
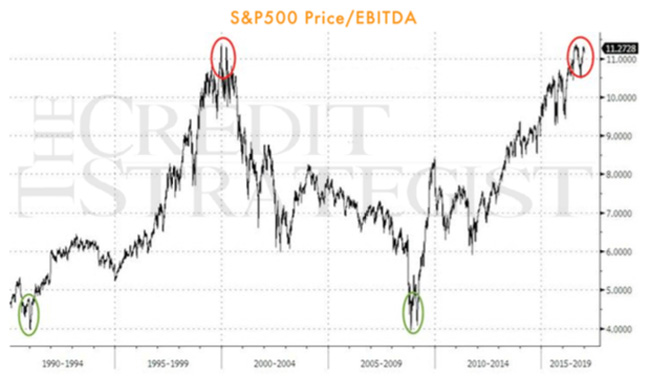
Source: The Credit Strategist
This tells us that the current rally can be largely attributed to “valuation expansion.” Indeed, around 60% of the gains since 2009 have come from this source. At the same time, earnings growth has been anemic.
From 2012–2016, annual earnings growth was just 0.49%. In comparison, from 1995–1999, growth was 9.5%.
Chart #2: CAPE
Another commonly used metric is the cyclically adjusted, price-to-earnings ratio (CAPE).
Currently, the CAPE is 73% above its mean. Besides its reading before the 1929 crash and dot-com bubble, the ratio is at its highest level on record.
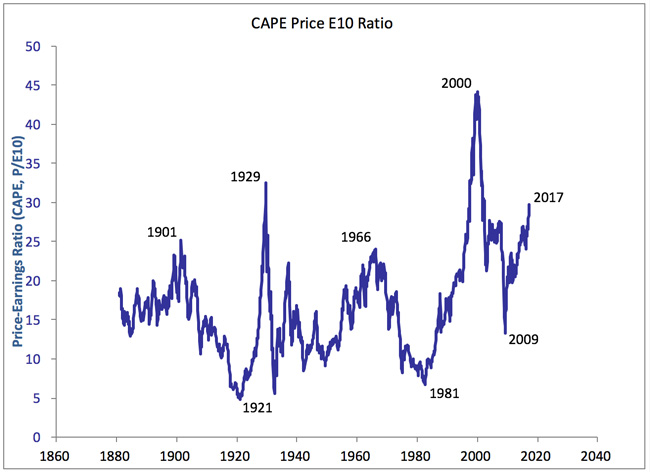
Source: Robert Shiller
Chart #3: Total Market Cap/GDP
Warren Buffet’s favorite valuation metric, total market cap relative to GDP, currently stands at 130%—a 129% increase since 2009. This rise also brings the ratio to its highest level since 2000.
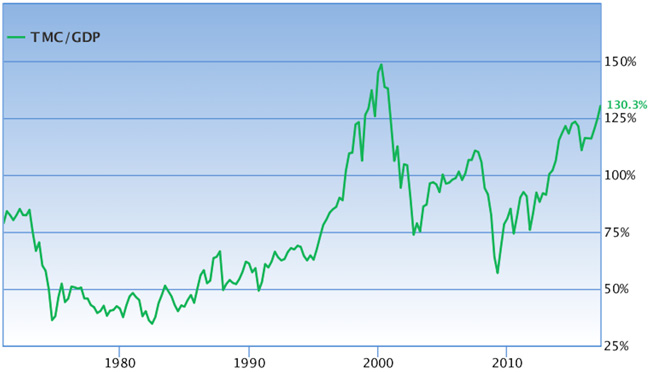
Source: Gurufocus
Chart #4: NYSE Margin Debt
High levels of margin debt lead to increased volatility as more people are forced to sell due to margin calls.
In January, margin debt hit another record high. The two previous tops were one month and three months prior to the respective 2000 and 2008 market crashes.
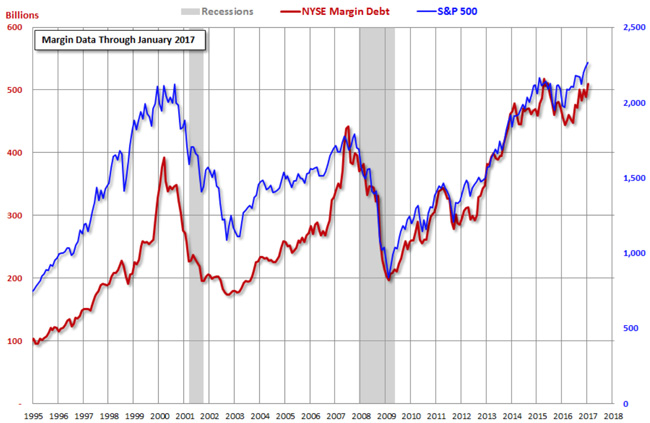
Source: Advisor Perspectives
Chart #5: The Complacency Index
Margin debt making another “all-time high” signals the cycle is in late stages when complacency takes hold. And surprise, surprise, that too is at all-time highs.
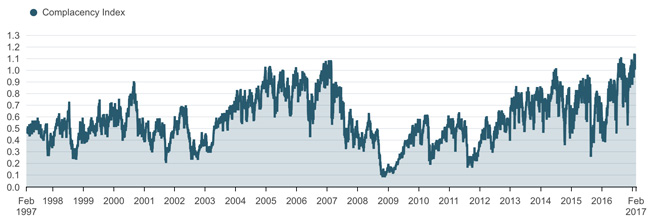
Source: Bloomberg
In the past, when the complacency index was high, stocks invariably saw big corrections shortly thereafter.
By most metrics, equities look pricey. But even with the bull market now eight years old, sentiment continues to be extremely bullish. So, what are the takeaways from these lofty valuations?
Lower Future Returns and Higher Downside Risk
To quote Warren Buffet, “The price you pay determines your rate of return.” In a nutshell, this sums up what today’s valuations mean for investors.
High valuation metrics aren’t indicative of an imminent market crash. What they do tell us is that we must lower our expectations of future returns.
While the correlation isn’t perfect, this chart shows a higher CAPE ratio usually means lower future returns.
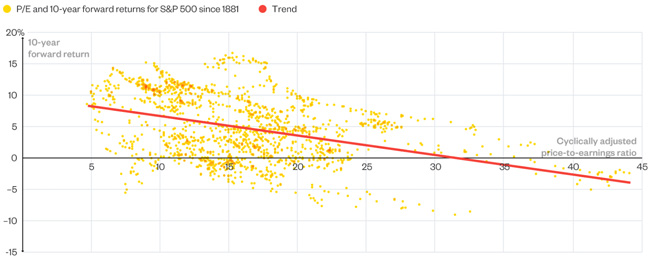
Source: Bloomberg
With the stunning run-up in markets since 2009, investors can’t reasonable expect returns to continue at double the long-term average. At a time of exuberance, it’s important to remember markets are cyclical.
The other takeaway from today’s valuations is that when the drawdown does come, it will be severe. As this chart from Star Capital shows, downside risk tends to increase as market valuations become excessive.
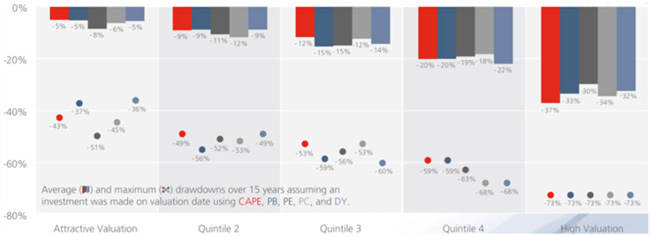
Source: Star Capital
Given current market levels, investors may want to lower their future expected returns. It’s important to note that “record highs” are records for a reason. It’s where previous limits were reached.
With that in mind, how should investors approach the markets today?
Adopt a Contrarian Investment Strategy
While markets continue to make new highs, investors should proceed with care. This is the second-longest period in stock market history without a 10% correction. As detailed above, the higher valuations go, the worst the subsequent drop.
The average decline during the last five bear markets was 33%—the next one could be much worse. Of course, markets could rise another 50% from here before falling. But given their run-up since 2009—is it a risk worth taking?
Luckily, astute investors can still find value in today’s frothy markets by taking a contrarian approach to investing. In short, investors can limit their downside risk by searching for out-of-favor sectors and companies that have lagged the market—like healthcare.
Free report reveals: How to Eliminate Stock Market Risk with 3 Proven Investment Strategies
If you’re tired of being lied to by all those so-called “investment gurus” promising a sure-fire way to get 1,000% returns... but still need a system to safely get stock market returns…you need a copy of Garret/Galland Research's latest free special report.
Click here to learn more about this proven investing system that will change how you invest forever.
David Galland
Managing Editor, The Passing Parade
Garret/Galland Research provides private investors and financial service professionals with original research on compelling investments uncovered by our team. Sign up for one or both of our free weekly e-letters. The Passing Parade offers fast-paced, entertaining, and always interesting observations on the global economy, markets, and more. Sign up now… it’s free!
© 2017 David Galland - All Rights Reserved
Disclaimer: The above is a matter of opinion provided for general information purposes only and is not intended as investment advice. Information and analysis above are derived from sources and utilising methods believed to be reliable, but we cannot accept responsibility for any losses you may incur as a result of this analysis. Individuals should consult with their personal financial advisors.
© 2005-2022 http://www.MarketOracle.co.uk - The Market Oracle is a FREE Daily Financial Markets Analysis & Forecasting online publication.