


SPX Uptrend continues to make New All-time Highs
Stock-Markets / Stock Market 2017 Mar 04, 2017 - 06:30 PM GMTBy: Tony_Caldaro

 The week started at SPX 2367. On Monday the SPX rose to 2372, pulled back to 2359 on Tuesday, then gapped up on Wednesday hitting an all-time high of SPX 2401. Thursday and Friday saw the SPX pullback to 2375 before ending the week at 2383. For the week the SPX/DOW gained 0.80%, and the NDX/NAZ gained 0.50%. Economic reports for the week were mostly higher. On the downtick: pending home sales, construction spending, the WLEI and the Q1 GDP estimate. On the uptick: durable goods, consumer confidence, the Chicago PMI, personal income/spending, ISM manufacturing/services, the PCE, plus weekly jobless claims hit a 44-year low. Next week’s reports will be highlighted by monthly payrolls, factory orders and export/import prices. Best to your weekend and week!
LONG TERM: uptrend
Last weekend we noted the weekly RSI was getting into rare overbought territory. It had ended the week at 89.94 and was reaching the typical 90+ overbought reading that comes in third of third waves. This week it ended at 91.63, the highest overbought level since early 2004. Not the last bull market, the previous one. The peak reading of the 2009-2015 bull market occurred in 2010. The peak reading of the 2002-2007 bull market occurred in 2004. Upside momentum is certainly in favor of a continuing bull market.
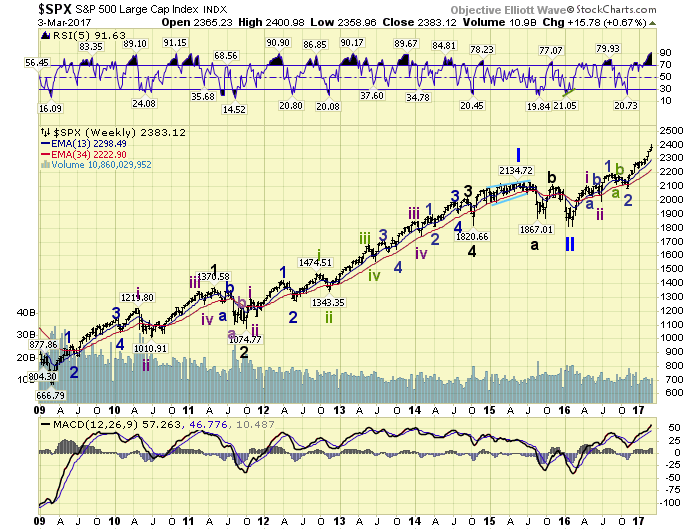
The long term count remains unchanged. A Super cycle bear market ended in 2009 at SPX 667. A Primary I bull market ended at SPX 2135 in 2015. A Primary II bear market ended at SPX 1810 in 2016. And a Primary III bull market has been underway since then. The first phase, Major wave 1, of the five Major wave Primary III bull market is underway. Major wave 1 is dividing into five Intermediate waves. Intermediate waves i and ii completed in April and June. Minor waves 1 and 2, of Int. iii, completed in August and November. Minor wave 3, of Int. iii, has been underway since then. Still expecting a top around SPX 3000+ between the years 2018 and 2020.
MEDIUM TERM: uptrend
This Minor 3 uptrend started in early November at SPX 2084 and is still underway. It is now into its 4th month, twice as long as either of the two previous uptrends. Also it has travelled more SPX points than either of those two uptrends, and has already gained 15.2% from the November low.
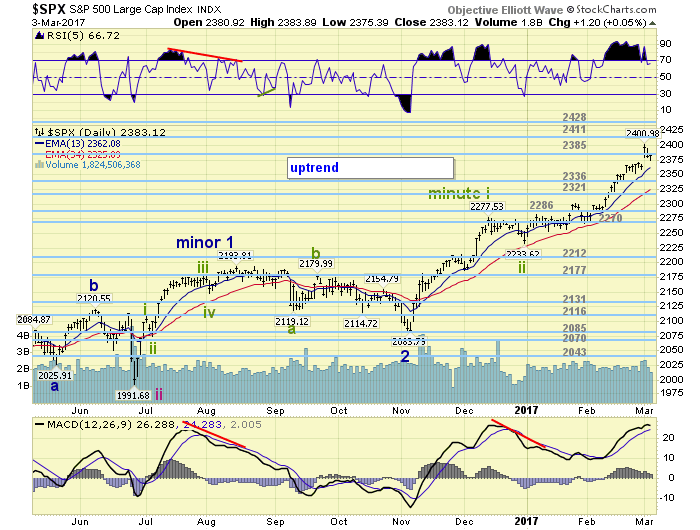
We have been labeling this uptrend with five Minute waves. Minute waves i and ii both completed in December, and Minute iii has been underway since then. Minute i was fairly simple with five subdividing Micro waves. Minute iii appears to be subdividing into a more complex pattern which we will cover below. When it concludes, there should be a Minute iv pullback, and then a Minute v advance to new highs before this uptrend ends. Medium term support is at the 2336 and 2321 pivots, with resistance at the 2385 and 2411 pivots.
SHORT TERM
As noted above Minute iii appears more complex than Minute i. We have labeled Micro waves 1 and 2 at SPX 2282 and SPX 2257 respectively. Micro 3, however, we have subdividing into five Nano waves. Nano waves 1 and 2 completed at SPX 2301 and SPX 2267 respectively. Nano wave 3 may have topped at SPX 2401, with a series of nine smaller waves.
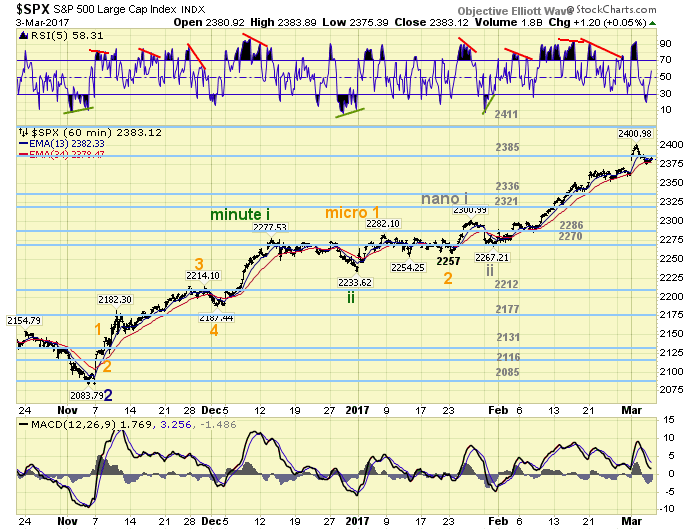
Should the pullback continue and decline into the low SPX 2360’s, then it is likely Nano wave iv. If not, the recent pullback, which is the largest since Nano ii, may only be the 10th wave of a 13 wave pattern. Either way the uptrend has further to go before it concludes. Short term support is at SPX 2353 and the 2336 pivot, with resistance at the 2385 pivot and SPX 2401. Short term momentum ended the week above neutral. Best to your trading!
FOREIGN MARKETS
Asian markets were mostly lower on the week for a net loss of 0.4%.
European markets were all higher and gained 3.0%.
The DJ World index gained 0.4%, and the NYSE gained 0.5%.
COMMODITIES
Bonds are in an uptrend but lost 1.1% on the week.
Crude is also in an uptrend and lost 1.2%.
Gold appears to be in a downtrend and lost 2.5% on the week.
The USD is in an uptrend and gained 0.3%.
NEXT WEEK
Monday: factory orders at 10am. Tuesday: trade deficit and consumer credit. Wednesday: the ADP index. Thursday: the ECB meets, export/import prices and weekly jobless claims. Friday: monthly payrolls and the unemployment rate.
CHARTS: http://stockcharts.com/public/1269446/tenpp
After about 40 years of investing in the markets one learns that the markets are constantly changing, not only in price, but in what drives the markets. In the 1960s, the Nifty Fifty were the leaders of the stock market. In the 1970s, stock selection using Technical Analysis was important, as the market stayed with a trading range for the entire decade. In the 1980s, the market finally broke out of it doldrums, as the DOW broke through 1100 in 1982, and launched the greatest bull market on record.
Sharing is an important aspect of a life. Over 100 people have joined our group, from all walks of life, covering twenty three countries across the globe. It's been the most fun I have ever had in the market. Sharing uncommon knowledge, with investors. In hope of aiding them in finding their financial independence.
Copyright © 2017 Tony Caldaro - All Rights Reserved Disclaimer: The above is a matter of opinion provided for general information purposes only and is not intended as investment advice. Information and analysis above are derived from sources and utilising methods believed to be reliable, but we cannot accept responsibility for any losses you may incur as a result of this analysis. Individuals should consult with their personal financial advisors.
Tony Caldaro Archive |
© 2005-2022 http://www.MarketOracle.co.uk - The Market Oracle is a FREE Daily Financial Markets Analysis & Forecasting online publication.