


Oil Majors' Costs Have Risen 66% Since 2011
Commodities / Oil Companies Mar 02, 2017 - 01:15 PM GMTBy: OilPrice_Com

 The oil majors reported poor earnings for the fourth quarter of last year, but many oil executives struck an optimistic tone about the road ahead. Oil prices have stabilized and the cost cutting measures implemented over the past three years should allow companies to turn a profit even though crude trades for about half of what it did back in 2014.
The collapse of oil prices forced the majors to slash spending on exploration, cut employees, defer projects, and look for efficiencies. That allowed them to successfully lower their breakeven price for oil projects. However, some of that could be temporary, with oilfield services companies now demanding higher prices for equipment and drilling jobs, in some cases upping prices by as much as 20 percent. The result could be an uptick in the cost of producing oil for the first time in a few years. Rystad Energy estimated the average shale project could see costs rise by $1.60 per barrel, rising to $36.50.
That does not seem like the end of the world. After all, those breakeven prices are still dramatically lower than what they were back in 2014. In fact, Reuters put together a series of charts depicting the fall in costs for shale production in different parts of the United States. Every major shale basin – the Eagle Ford, the Bakken, the Niobrara, and the Midland and Delaware basins in the Permian – have seen breakeven prices fall by as much as half since 2013. The slight uptick in costs expected in 2017 is a rounding error compared to the reductions over the past half-decade.
But that is just for shale drilling. The oil majors produce most of their oil outside of the shale patch, with much of their output coming from longer-lived projects in deepwater, for example. To be sure, some of the largest oil companies have made some progress in cutting costs over the past few years, but a new report casts doubt on the industry’s track record.
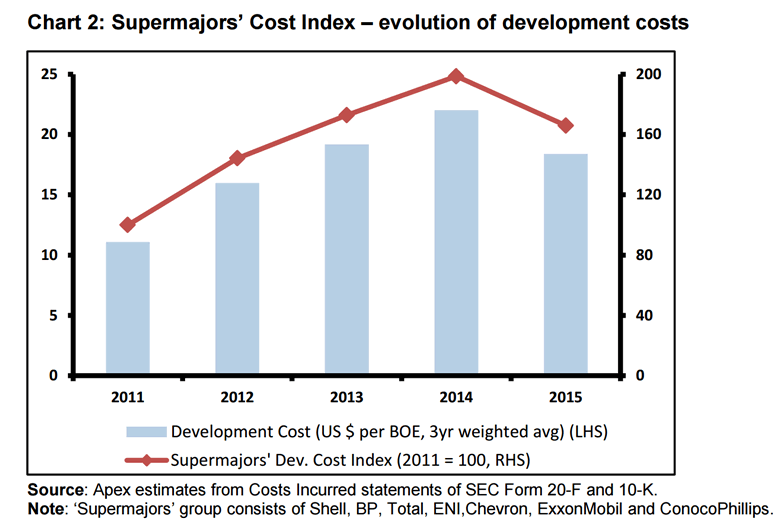
According to new research from Apex Consulting Ltd., the oil majors are still spending more to develop a barrel of oil equivalent than they were before the downturn in prices – in fact, much more. Apex put together a proprietary index that measures cost pressure for the “supermajors” – ExxonMobil, Royal Dutch Shell, Chevron, Eni, Total and ConocoPhillips. Dubbed the “Supermajors’ Cost Index,” Apex concludes that the supermajors spent 66 percent more on development costs in 2015 than they did in 2011, despite the widely-touted “efficiency gains” implemented during the worst of the market slump. It is important to note that this measures “development costs,” and not exploration or operational costs.
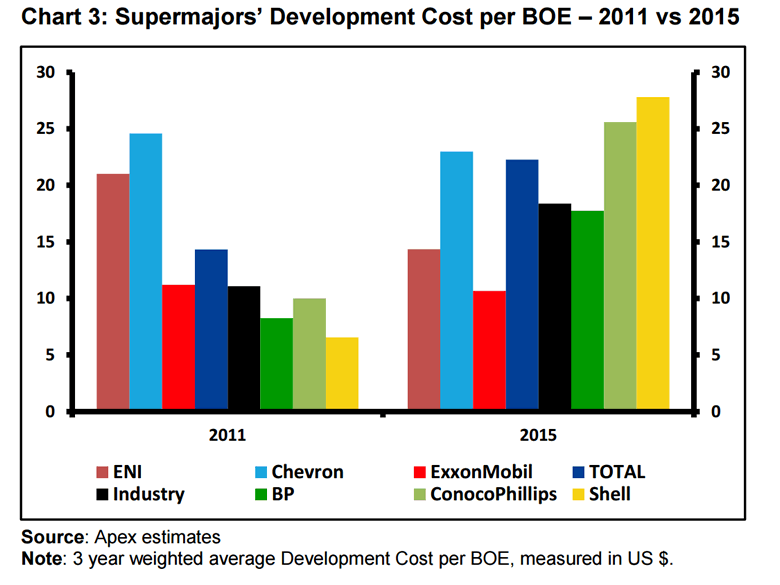
However, performances varied by company. Eni, for example, saw its development costs decline by 32 percent between 2011 and 2015, a notable achievement. Chevron and ExxonMobil also posted efficiency gains, although more modest figures than Eni. Chevron’s costs fell 6 percent and Exxon’s were down 5 percent over the five-year period.
At the other end of the spectrum is Royal Dutch Shell, which saw development costs quadruple. ConocoPhillips and BP fared only slightly better, with costs roughly doubling over the timeframe. As a whole, the development costs for the group of “supermajors” rose 66 percent to $18.39 per barrel.
After the collapse of oil prices in 2014, the cost index did decline. Oil producers squeezed their suppliers, streamlined operations, and improved drilling techniques. But costs still stood 66 percent higher than in 2011.
The index points to underlying structural increases in development costs for the broader industry.
At $18 per barrel, the cost figure would seem rather low. But it is important to note that this is just for “development costs,” which represent just over half of a company’s total cost. That figure excludes the cost of exploration as well as funding ongoing operations. So the “breakeven price” so often quoted in the media is actually quite a bit higher. BP, for example, recently admitted that its finances will not breakeven unless oil trades at roughly $60 per barrel.
The supermajors are in a tricky position. They are trying to cut back on spending in order to fix their finances and pay down the massive pile of debt that they have accumulated in the past few years. However, their reserves will decline if they fail to replace them. Exxon, for example, only replaced 67 percent of the oil it produced in 2015.
Moreover, as Apex Consulting notes, oilfield services might demand higher prices in the future as drilling activity picks up. Right now, offshore rigs are still underutilized, meaning that price inflation has yet to kick in.
In other words, the decline in costs post-2014 are, at least in part, cyclical. Costs will rise again as activity picks up unless oil producers work with their suppliers to address the underlying structural costs of oil production.
Link to original article: http://oilprice.com/Energy/Energy-General/Oil-Majors-Costs-Have-Risen-66-Since-2011.html
By Nick Cunningham
© 2017 Copyright OilPrice.com - All Rights Reserved
Disclaimer: The above is a matter of opinion provided for general information purposes only and is not intended as investment advice. Information and analysis above are derived from sources and utilising methods believed to be reliable, but we cannot accept responsibility for any losses you may incur as a result of this analysis. Individuals should consult with their personal financial advisors.
OilPrice.com Archive |
© 2005-2022 http://www.MarketOracle.co.uk - The Market Oracle is a FREE Daily Financial Markets Analysis & Forecasting online publication.