


Stock Market SPX New All-time Highs Continue
Stock-Markets / Stock Market 2017 Feb 25, 2017 - 02:09 PM GMTBy: Tony_Caldaro

 The SPX started the holiday shortened week at 2351. The market opened higher on Tuesday, rallied to a new high at SPX 2367, then pulled back to 2358 on Wednesday. After opening at another new high, SPX 2368, on Thursday, the market pulled back to 2353 on Friday before ending the week at 2367. For the week the SPX/DOW gained 0.85%, and the NDX/NAZ gained 0.25%. Economic reports for the week were sparse and mostly positive. On the downtick: the WLEI plus weekly jobless claims rose. On the uptick: existing/new home sales, consumer sentiment and the FHFA housing index. Next week’s reports will be highlighted by the FED’s beige book, the ISMs and the Q4 GDP second estimate.
LONG TERM: uptrend
With February nearly in the books, the SPX is currently +3.9% for the month. Not bad when considering if this uptrend had followed the path of the previous two impulsive uptrends, the market would probably have been in the middle of a 5% correction long before now. With this uptrend stretching into three months, and possibly four as March starts next week, there has been some concern about the overbought condition in the weekly RSI. With this in mind we checked the previous bull market overbought levels, and they are noted on the chart below. Notice 2 of the 3 highest overbought conditions occurred within the middle, three of three, of Major wave 1 and Major wave 3. And, they both topped out just over 90%. With the current reading at 89.94%, and the wave count in a Minor 3 of Intermediate iii, it certainly looks like a bull market and this uptrend still has some upside left.
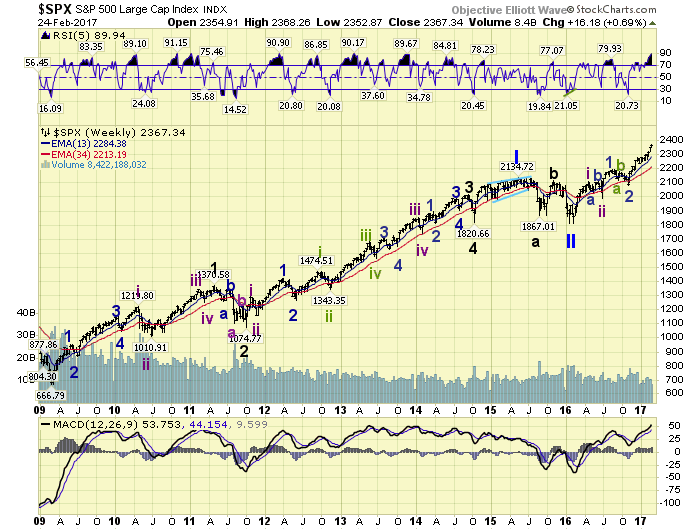
We continue to label this bull market as a Primary wave III. A Primary I bull market unfolded between 2009 and 2015. Then Primary II declined into 2016. Primary III began at the February SPX 1810 low. The first impulsive uptrend we labeled Int. i, and the correction that followed Int. ii. The next impulsive uptrend was labeled Minor 1 of Int. iii and the correction that followed Minor wave 2. From that early-November SPX 2084 low we have been tracking this uptrend as Minor wave 3 of Int. iii. Our target all along for this uptrend had been the SPX 2380’s. The SPX reached the 2360’s this week.
MEDIUM TERM: uptrend
As noted this uptrend began in early-November, just before the election, at SPX 2084. We counted five waves up into mid-December, and labeled that high Minute wave i of Minor wave 3. Then the pullback that followed into late-December we labeled Minute wave ii. Since that low the market has been rising in Minute wave iii of Minor 3.
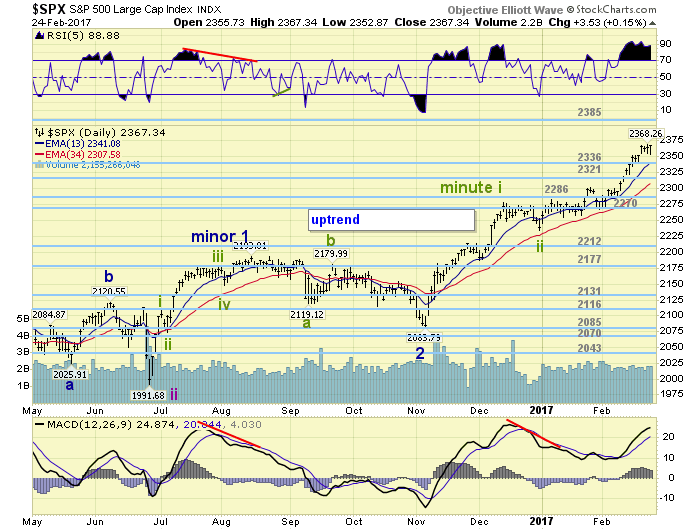
We had labeled Minute i with five Micro waves, see hourly chart below. And we continue to label Minute wave iii with three Micro waves thus far. Micro 3 of Minute iii began in the later part of January. While this Micro 3 has also had some subdivisions, we’re just trying to keep the charts simple as this wave unfolds. We are expecting Micro 3 to reach the OEW 2385 pivot range before it concludes. Then after a Micro 4 pullback, Micro 5 should make a higher high to complete Minute wave iii. But that does not end the uptrend. After a Minute iv pullback, Minute should also make a higher high to complete Minor wave 3. Then a Minor 4 correction of 5% or more should unfold. Medium term support is at the 2336 and 2321 pivots, with resistance at the 2385 and 2411 pivots.
SHORT TERM
Minute i unfolded in five waves SPX: 2147-2125-2214-2187-2278. Then after a three wave pullback to SPX 2234 for Minute ii, Minute iii was underway. Thus far we have only labeled the first two waves of Minute iii SPX: 2282-2257. The third wave, which has risen to SPX 2368 this week, also has some subdivisions. This suggests the market could become choppy for a while as it works its way higher. We may have seen the beginning of this with this week’s series of pullbacks after each new high.
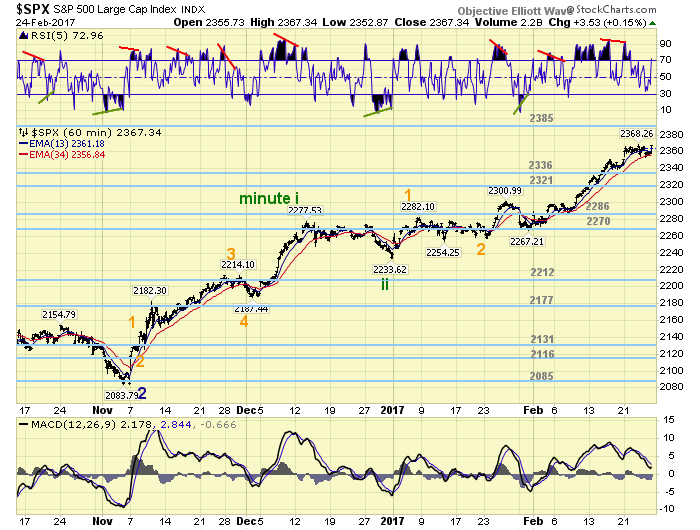
Short term support is at SPX 2353 and the 2336 pivot, with resistance at SPX 2368 and the 2385 pivot. Short term momentum nearly hit oversold on Friday before ending the day overbought. Best to your trading!
FOREIGN MARKETS
Asian markets were mostly higher and gained 0.5% on the week.
European markets were mostly lower and lost 0.6%.
The DJ World index gained 0.3%, and the NYSE gained 0.3%.
COMMODITIES
Bonds are back in an uptrend and gained 0.7%.
Crude is also in an uptrend and gained 0.4%.
Gold’s uptrend remains as it gained 1.6%.
The USD is also trying to uptrend and gained 0.2% on the week.
NEXT WEEK
Monday: durable goods at 8:30, then pending home sales at 10am. Tuesday: Q4 GDP, the Chicago PMI and consumer confidence. Wednesday: personal income/spending, the PCE, construction spending, ISM, auto sales and the FED beige book. Thursday: weekly jobless claims. Friday: ISM services, a speech from FED vice chair Fischer, and a speech from FED chair Yellen. Best to your weekend and week!
CHARTS: http://stockcharts.com/public/1269446/tenpp
After about 40 years of investing in the markets one learns that the markets are constantly changing, not only in price, but in what drives the markets. In the 1960s, the Nifty Fifty were the leaders of the stock market. In the 1970s, stock selection using Technical Analysis was important, as the market stayed with a trading range for the entire decade. In the 1980s, the market finally broke out of it doldrums, as the DOW broke through 1100 in 1982, and launched the greatest bull market on record.
Sharing is an important aspect of a life. Over 100 people have joined our group, from all walks of life, covering twenty three countries across the globe. It's been the most fun I have ever had in the market. Sharing uncommon knowledge, with investors. In hope of aiding them in finding their financial independence.
Copyright © 2017 Tony Caldaro - All Rights Reserved Disclaimer: The above is a matter of opinion provided for general information purposes only and is not intended as investment advice. Information and analysis above are derived from sources and utilising methods believed to be reliable, but we cannot accept responsibility for any losses you may incur as a result of this analysis. Individuals should consult with their personal financial advisors.
Tony Caldaro Archive |
© 2005-2022 http://www.MarketOracle.co.uk - The Market Oracle is a FREE Daily Financial Markets Analysis & Forecasting online publication.